
Team Sep 21, 2022 No Comments

Updated on August, 2024
Data science interviews can be scary.
Just imagine sitting across from a panel of serious-looking experts who are here to judge you. Your heart is racing, your palms are sweating, and you start breathing quickly. You can feel it.
It’s normal to feel a little overwhelmed in interviews. But here’s the good news: You can overcome this fear with the right preparation.
In this blog post, I will guide you through the essential steps and useful tips for data science interview preparation. This will help you walk into the room feeling confident and positive.
But before that, let’s first understand this…
The simple answer is data science interviews can be challenging. You need to prepare several different topics like data analysis, statistics and probability, machine learning, deep learning, programming, etc. You may have to revise the whole data science syllabus.
And these technical skills aren’t enough. You also need good communication skills, business understanding, and the ability to explain your work to business stakeholders.
You know the purpose of a data science interview is to test your knowledge, skills, and problem-solving abilities. If you haven’t brushed up on your skills recently, it can be a lot of work. So, let’s start from the beginning…
As I said earlier, preparation is the key to success in data science interviews. And it all starts with a strong foundation that involves:
If you don’t have these, you can join a good course like Ivy Professional School’s Data Science Certification Program made with E&ICT Academy, IIT Guwahati.
It will not only help you learn in-demand skills and work on interesting projects but also prepare for interviews by building a good resume, improving soft skills, practicing mock interviews, etc.
Besides, you will receive an industry-recognized certificate from IIT on completion of the course. This will surely boost your credibility and help you stand out in the interview.
Now, I will share some tips for data science interview preparation that have helped thousands of students secure placements in big MNCs.
These tips will boost your preparation and help you understand how to crack a data science interview like a pro.
This is the first and most important thing to do. Why? Because it will show the interviewer that you are serious about the opportunity. It will also help you provide relevant answers and ask the right questions in the interview.
All you have to do is go to the company’s website and read their About page and blog posts to understand their products, services, customers, values, mission, etc. Also, thoroughly read the job description to understand the key skills and responsibilities.
The goal is to find out how your knowledge and experiences make you a suitable candidate for the role.
Your resume is your first impression. It helps you stand out, catch the interviewer’s attention, and show why you are the right fit for the job. So, you have to make sure it’s good.
What do you mention in your resume? Here are some of the important sections:
Here’s the most important thing: Tailor your resume according to the company’s needs, values, and requirements. That means you should have a different resume for each job application.
What projects you have worked on is one of the most common areas where interviewers focus. That’s because it directly shows how strong a grasp you have over data science skills and whether you can use your skills to solve real-world problems.
So, go through each project you have listed in your data science portfolio. See the code you wrote, the techniques you used, the challenges you faced, and the steps you took to solve the problem. You should be able to explain each project clearly and concisely, from the problem statement to the results you got.
Technical interviews are where the interviewer evaluates whether you have the skills and expertise to perform the job effectively. For this, you need a solid foundation of the latest data science skills.
You should revise all the tools and programming languages like Excel, SQL, Python, Tableau, R, etc., which you have mentioned in your resume. Besides, go through the core concepts like data analysis, data visualization, machine learning, deep learning, etc.
Pro tip: Learn from the data science interview experience of people who have already cracked interviews and secured placements. For instance, this YouTube video shares the experience of one of Ivy Pro’s learners who cracked the interview at NielsenIQ:
I can’t emphasize the importance of this step. Being prepared helps you answer effectively and make a lasting impression.
So, find common questions asked in data science interviews and prepare clear and concise answers. Here are some technical and behavioral questions:
These are just examples. You can do your research or ask professionals in your network to find the most common questions. This will surely make you more confident about your data science interview preparation.
Albert Mehrabian, a professor of Psychology, found that communication is 55% body language, 38% tone of voice, and 7% words only.
So, while your technical skills and experience are important, your body language can make or break your chances of success in the interview.
Here are simple ways to improve your body language:
Your body language shows your confidence and attitude, so try to make it perfect.
Mock interviews can boost your data science interview preparation. It helps you improve your answers and body language, increase confidence, and get used to the scary interview environment.
You can simply practice it with your friends or do it alone by recording yourself while you speak. But the best way to do it is to join a course where they let you practice mock interviews.
For instance, Ivy Pro’s Data Science Course with IIT Guwahati helps you practice mock interviews and learn soft skills. This way, you get feedback to understand your strengths and areas of improvement.
Now, you know how to prepare for a data science interview and crack it with confidence. You need to build a strong foundation in relevant skills, gain hands-on experience, and create a compelling portfolio. Your technical expertise, body language, and attitude are what will help you stand out and land your dream job. So, get started with it. The stronger the preparation, the more your chances of success.

Prateek Agrawal is the founder and director of Ivy Professional School. He is ranked among the top 20 analytics and data science academicians in India. With over 16 years of experience in consulting and analytics, Prateek has advised more than 50 leading companies worldwide and taught over 7,000 students from top universities like IIT Kharagpur, IIM Kolkata, IIT Delhi, and others.
Team Sep 18, 2022 No Comments
Everywhere we read, we see the power of data science. Data science is changing the world we are living in. Everyone is concerned about data. Businesses are keen on evaluating how data can help them to cut off expenses and enhance their bottom line. Businesses from every niche are now interested in data science and the stock market is no different. In this article, we will have a look at stock market data analytics and how it boosts the graphs of the stock market.
Data science is typically portrayed in numbers. But these numbers should imply anything that ranges from the number of users who buy a product to the amount of inventory that is sold. Of course, these numbers should also portray cash.
Now coming to stock market data analytics. Here we can either sell, buy, or hold. The aim is to make the biggest profit possible. The question that many are aiming to answer is about the role that data science plays in helping us conduct trades in the stock market. Trading platforms have become very famous in the last two decades, but each platform provides varied options, fees, tools, and many more. Despite the evolving trend, there are many nations that have still not been able to access zero trading commission platforms. This article is based on stock market data analytics India.
There are numerous phrases that are used in data science that a person would be required to be a scientist to understand. At its most primary level, data science is mathematics that is carved with an understanding of statistics and programming.
There are various concepts in data science that are applied when analysing the market. In this respect, we are employing the term “analyze” to evaluate whether it is worth it to make investment in it. There are some primary data science ideas that are ideal to be familiar with.
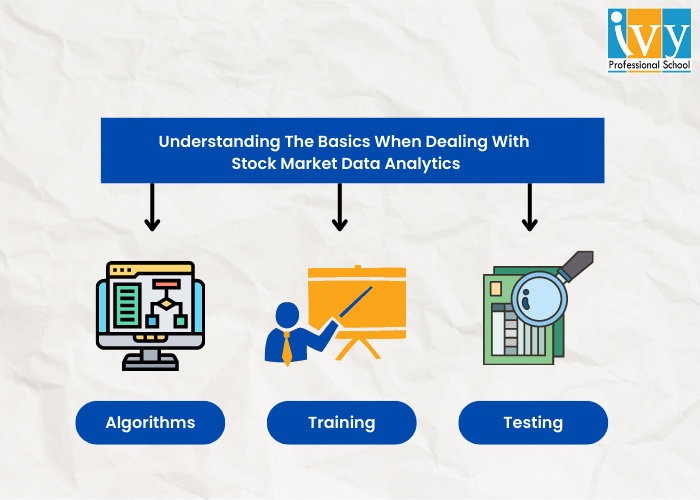
Algorithms are utilized extensively in data science. Basically an algorithm is a group of regulation required to perform a task. You have mostly heard about algorithms being used when purchased and selling stocks. Algorithmic trading is where algorithms fix rules for things such as when to purchase a stock or when to sell a stock.
For instance, an algorithm could be created to buy a stock once it drops by 8% in the entire day or to sell the stocks if it loses 10% of its value in comparison to when it was bought initially. Algorithms are formed to operate without human intervention. You might have heard about them referred to as bots. Like robots, they make calculated decisions that are devoid of emotions.
We are not discussing preparing to operate a 50 metre race. In ML (Machine learning) and also data science, training is where data is utilized in training a machine on how to revert back. We can formulate a learning structure. This machine learning framework makes it possible for a computer to offer accurate predictions that are based on the data it learned from the past. If you wish to teach a machine to anticipate the future of the values of stocks, it would require a structure of the stock prices of the last year to utilise as a base to anticipate what will occur.
Let us start with a stock market data analysis project. We have the real data for stock values from the previous year. The training set would be the real data from January to October. Then the data from November to December can be used for any testing set. Our machines should have understood by assessing how the stocks operated from January through October. Now, we will ask our machines to anticipate what should have occurred in November and December of that year. The predictions that will be made by the machine will be then compared to real values. The amount of variation seen in the prediction of the model and the real data are what we are aiming to discard as we adjust our training framework.
Data science depends heavily on structuring. This is a strategy that uses mathematics to examine previous behaviours with the aim of forecasting upcoming results. In the stock market, a time series model is employed.
A time series is basically data which in this scenario refers to the value of a stock that is indexed over a span of time. This span of time could be divided on an hourly, daily, monthly, or even minute basis. A time series module is formulated by using machine learning or deep learning models to fit the time data. The data requires to be analyzed and then fitted to match the structure. This is why it is effective to anticipate future values of stocks over a fixed timetable.
A second form of modeling that is employed in data science and machine learning is termed as a classification structure. These structures are offered data points and they aim to anticipate or classify what is portrayed by those data points.
When talking about the stock market or even stocks in general, a ML framework can be given financial data such as the P/E ratio, volume, total debt, and many more and then evaluate if you are making a sound investment. Depending on the basic financials we offer, a model can evaluate if now is the time to hold, sell, or purchase a stock.
A model could anticipate something with so many complications that it overlooks the relationship between the feature and the target variable. This is termed as overfitting. Underfitting is where a framework does not sufficiently cater to the data, so the outcomes are anticipations that are very simple.
Overfitting is an issue in stock market data analytics if the model finds it hard to identify stock market trends, so it cannot adapt to future incidents. It is where a structure anticipates the simple average price that is based on the complete history of the stocks. Both overfitting & underfitting lead to poor anticipations and forecasts.
We have barely scratched the surface when talking about the connection between machine learning ideas and stock market investments. However, it is crucial to evaluate the primary concepts we have discussed previously as they cater as a basis for comprehending how ML is employed to anticipate what the stock market can do. There are more ideas that can be learned by those who wish to receive the nitty-gritty stock market data analytics.
Team Sep 17, 2022 No Comments
Keras is an easy-to-use, strong, free open-source Python library for evaluating and developing deep learning frameworks. This is a part of the TensorFlow library and enables you to illustrate and train neural network structures in just some lines of code. In this article, we will be talking about what is Keras and TensorFlow.
Let us start this Keras tutorial. Keras was formulated to be quite user-friendly, easy to extend, modular, and to work with Python. The API was “designed for human beings, not machines” and “follows best practices for reducing cognitive load.”
Neural layers, optimizers, cost operations, activation operations, initialization schemes, and regularization schemes are all standalone structures that one can combine to formulate a new module. New modules are easy to add, as new functions and classes. Models are illustrated in Python code, not different structure configuration models.
In this article on what is Keras in Python, let us have a look at the key features of Keras:
Being a high-level library and is a convenient interface, Kears certainly boosts as one of the deep learning libraries that is available. There are several features of itself, which makes it more convenient to use and also offers more features.
– If Keras is compared with and Theano, it tries to offer a better “user Experience” and this zones Keras above the other two libraries.
– As this is a Python library, it is more available to the general public because of the inherent simplicity of the Python programming language.
– Lasagne is a library that is very similar to Kears. But using both the libraries I can say Keras is much more convenient.
Now that you know the advantages of using the Keras library, you should also be aware of the disadvantages of Kears.
– Since this Python library has its dependency on low-level languages such as TensorFlow and Theano, so this performs as a double-edged sword for Keras. This is the primary reason why Keras cannot move beyond the realms of these libraries. For instance, both TensorFlow and Theano presently do not support GPUs except Nvidia. That is the reason Keras also does not have the corresponding support.
– Similar to Lasagne, eras also wholly abstract the low, level languages. So this is less flexible when it comes to creating custom functions.
– The final point is that this is new in this niche. Its very first version was launched in late 2015, and it has gone through various alterations since then. Then even though Keras is already used in the process of production, one should always think twice before they deploy Keras models for production.
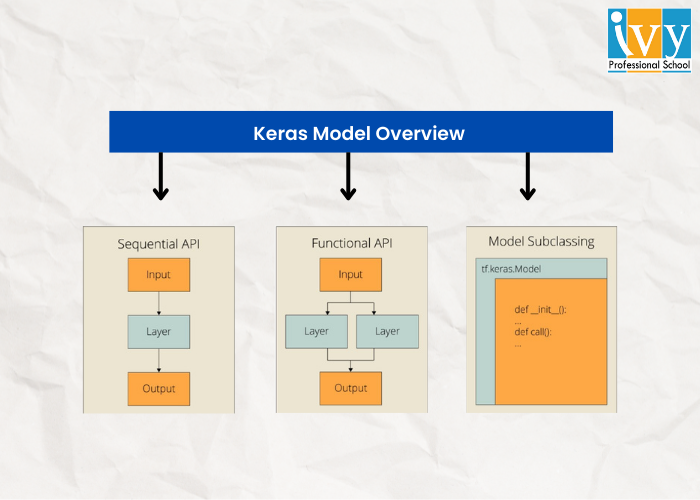
Models are the primary entity one will be working with when using Keras. The structures are used in defining TensorFlow neural networks by mentioning the attributes, operations, and layers you wish.
Keras provides a range of APIs you can employ to illustrate your neural network, involving:
– Sequential API allows one to formulate a model structure by structure for most issues. It is straightforward but restricted to single-input, single-output stacks of layers.
– Functional API is mainly a full-feature API that supports arbitrary framework architecture. It is more complicated and flexible in comparison to the sequential API.
– Model Subclassing allows one to enact everything from scratch. Ideal for research and highly complicated use scenarios, but it is hardly used in practice.
ML (Machine Learning) algorithms use a special form of an algorithm that is known as a Neural Network. Same as every machine learning algorithm, it also abides by the general ML workflow of data preprocessing and model evaluation. For ease of use, here are some of the to-dos on how to approach a Neural Network problem.
– See if there are issues where a neural network offers you an uplift over traditional algorithms.
– Conduct a survey for which neural network architecture is the most ideal required issue.
– Illustrate neural network architecture via language or library as per your choice.
– Change data into the ideal format and divide it into varied batches.
– As per your requirements, pre-process the data.
– Augmented data is utilized to magnify size and make better-trained frameworks.
– Batches are nourished by the neural network.
– Track alterations in training and validation data sets, and also train them.
– Test your frameworks.
After this article on what is Keras model, you come to know about how this is useful in the area of deep learning along with its benefits and also limitations. We have also seen how this Python library depends on low-level languages such as Theanos and TensorFlow. Also if you were wondering what is Keras vs TensorFlow, then you must have got your answer.
Career prospects in data science and data analytics have increased over time and this has become a much-acclaimed niche presently. If you wish to start your career in data science then there can be no better place than Ivy Professional School. It offers a complete course on data science conducted by industry experts. For more details, you can visit their website.
Team Sep 13, 2022 No Comments

Updated in May, 2024
Do you know Netflix and Spotify use the Scikit-learn library for content recommendations?
Scikit-learn is a powerful machine learning library in Python that’s primarily used for predictive analytics tasks such as classification and regression.
If you are a Python programmer or aspiring data scientist, you must master this library in depth. It will help you with projects like building content-based recommendation systems, predicting stock prices, analyzing customer behavior, etc.
In this blog post, we will explain what is Scikit-learn and what it is used for. So, let’s get started…
Scikit-learn is an open-source library in Python that helps us implement machine learning models. This library provides a collection of handy tools like regression and classification to simplify complex machine learning problems.
For programmers, AI professionals, and data scientists, Scikit-learn is a lifesaver. The library has a range of algorithms for different tasks, so you can easily find the right tool for your problem.
Now, there is often a slight confusion between “Sklearn” and “Scikit-learn.” Remember, both terms refer to the same thing: an efficient Python library.
Although Scikit-learn is specifically designed to build machine learning models, it’s not the best choice for tasks like data manipulation, reading, or summary generation.
Scikit-learn is built on the following Python libraries:
Scikit-learn was developed with real-world problems in mind. It’s user-friendly with a simple and intuitive interface. It improves your code quality, making it more robust and optimizing the speed.
Besides, the Scikit-learn community is supportive. With a massive user base and great documentation, you can learn from others and get help when you need it. You can discuss code, ask questions, and collaborate with developers.
Scikit-learn was created by David Cournapeau as a “Google Summer Of Code” project in 2007. It quickly caught the attention of the Python scientific computing community, with others joining to build the framework.
Since it was one of many extensions built on top of the core SciPy library, it was called “scikits.learn.”
Matthieu Brucher joined the project later, and he began to use it as a part of his own thesis work.
Then, in 2010, INRIA stepped in for a major turning point. They took the lead and released the first public version of Scikit-learn.
Since then, its popularity has exploded. A dedicated international community drives its development, with frequent new releases that improve functionality and add cutting-edge algorithms.
Scikit-learn development and maintenance is currently supported by major organizations like Microsoft, Nvidia, INRIA foundation, Chanel, etc.
The Scikit-learn library has become the de facto standard for ML (Machine Learning) implementations thanks to its comparatively easy-to-use API and supportive community. Here are some of the primary uses of Scikit-learn:
Here’s a small example of how Scikit-learn is used in Python for Logistic Regression:
from sklearn.linear_model import LogisticRegression; model = LogisticRegression().fit(X_train, y_train)
Explanation:
Now, you must have understood what is Scikit-learn in Python and what it is used for. Scikit-learn is a versatile Python library that is widely used for various machine learning tasks. Its simplicity and efficiency make it a valuable tool for beginners and professionals.
If you want to learn machine learning with the Scikit-learn library, you can join Ivy’s Data Science with Machine Learning and AI certification course.
This online course teaches everything from data analytics, data visualization, and machine learning to Gen AI in 45 weeks with 50+ real-life projects.
The course is made in partnership with E&ICT Academy IIT Guwahati, IBM, and NASSCOM to create effective and up-to-date learning programs.
Since 2008, Ivy has trained over 29,000+ students who are currently working in over 400 organizations, driving the technology revolution. If you want to be the next one, visit this page to learn more about Ivy’s Data Science with ML and AI Certification course.
Team Sep 01, 2022 No Comments
In the present scenario, data is the basis of virtually every association. Companies in the current market scenario produced a prominent quantity of the 79 zettabytes of big data anticipated by Statista and hence are responsible for the big share of its usage, storage, and processing. Data analytics frameworks are crucial to all large-scale data management and optimization efforts.
These frameworks combine effective processes with cutting-edge data technologies to formulate insight and effective strategies for the operations of the companies. Traditional models did not look at the requirements of the companies as a whole, hence playing with data and creating roadblocks to efficiency. Evaluating modern data analytics frameworks and imposing them successfully will be important for any business aiming to move ahead of the graph.
The data analytics framework in data analytics is a concrete mechanism for handling data analytics effectively and efficiently. But the term itself is used in various ways. At times, these illustrate data analytics frameworks. Will be talking about the whole process and also the best practices for handling data analytics. Major data analytics framework examples include, Sample, Model, and Assess (SEMMA), Explore, Modify, process, and the Cross-Industry Standard Process Data Mining (CRISP-DM) guidelines. In other scenarios, the phrase is used in connection with data analytics solutions such as Teradata Vantage, as well as burgeoning data trends like the data mesh design pattern.
In the case of practicals, think of data analytics frameworks as an amalgamation of technologies and processes. The prominent guidelines and also the solutions used will differ often broadly among companies. But the fundamental aim of data analytics frameworks is consistent and that is to help enterprises utilize analytics in a way that derives the the greatest possible value from the data. The scarcity of such a framework, and taking a piecemeal, disorganised strategy of data analysis is a choice in the present-day business world.

Companies typically base their data analytics frameworks on a clearly defined purpose. The aim of the basic data analytics framework can be initially something like “What business outcomes do we hope to achieve for our enterprise with data analytics?”. From there data teams are divided into different branches for more prominent operations.
This is among the most commonly used scenarios for analytics and the frameworks supporting them. Companies are required to be consistently cognizant of everything that impacts their bottom line and gathering KPI (key performance indicators) and evaluating them is how they maintain awareness.
A data analytics framework offers data teams processes and also tools for broad-ranging performance assessment. For example profitability across varied business units along with its narrower operations such as keeping track of customer facing applications regulating users, engagement, and also new user adoption.
Presently, it is impossible to develop a new item in a vacuum. Development must be informed by data that include historical sales figures, KPIs related to the success or failure of the competitor with a similar product or service, demand analysis, projections of potential product failures, and many more.
The ability of various modern devices ranging from smartphones and medical wearables to modern cars to collect consumer behaviour data adds another dimension of insight developers can draw upon. Data analytics frameworks assure that product teams can take advantage of the last mistakes and determine better product design strategies for the future.
With this framework in place, manufacturers and other heavy industrial businesses can evaluate machine health, anticipate the likelihood of failure, and schedule priority repairs when required. This helps to minimize equipment downtime and keep production schedules on track. These frameworks of data analytics offer the structure analysts need to gather all the information crucial to making these anticipations such as a number of previous repairs, equipment age, indicators to wear and tear overall effectiveness, and many more.
To attain optimal results by using any data analysis framework, support cutting-edge technologies and also solutions:
1. Given that modern enterprise data management is predominantly driven by cloud trends, your framework should already be cloud-ready but without sacrificing your on-premise data infrastructure.
2. The hybrid multi-cloud deployment will offer you the most flexibility in this respect, specifically if the analytic requirements of your organisation include real-time stream processing.
3. Also, data integration from all relevant sources is very crucial and the solution and also the tools you utilize as a part of your structure should support this.
4. An analytics channel with warehousing potential, for instance, can offer an effective foundation for integration.
5. Utilizing object storage infrastructure to formulate a data lake that operates along with a data warehouse assures that all structured, unstructured, and semi-structured data can be categorized and formatted properly for later analysis and processing.
With that let us have a look at some of the best frameworks for data analytics for this year.
This is an end-to-end ML (Machine Learning) platform that features a comprehensive, flexible framework of elements and also libraries along with community resources, allowing one to construct applications that are powered by ML more conveniently. It also makes it more convenient to integrate data such as graphs, SQL tables, images all together. This was first formulated by Google Brain Team and to this day this remains completely open-source.
Scikit-learn is an open-source ML library that is used in the Python programming language, featuring several classifications, clustering, and regression algorithms. It is created for incorporating numericals and scientific libraries such as NumPy and SciPy, both of which are used and developed in Python.
Keras is a famous open source software library that has the potential to operate atop other libraries such as TensorFlow, CNTK, and Theano. With ample data, you can paddle in AI and Deep Learning over this framework.
A data manipulation and analysis language that is written in Python and for Python provides operations and data structures for manipulating NumPy based time series and dates. It is employed to normalise messy and incomplete data with features of slicing, shaping, merging, and dicing datasets.
A library with avid support for Java, Python, Scala, and R, this data analytics framework can be utilised on Hadoop, Kubernetes, Apache Mesos, over cloud services that deal with several data sources.
If you successfully deploy a data analytics framework based on sound principles of data science and are supported by reliable, agile technologies, your company has the ability to identify various advantages. Here are some of the most notable advantages of data analytics frameworks.
A cloud-centric analytics framework enables the coexistence of multiple types of data and permits several methods of analytics. Together, it helps prominently speed up the integration and efficient use of data, cutting down on time to evaluate and minimizing performance bottlenecks.
Hence, less time is spent on preparing, processing, and also reconfiguring data implying more time can be devoted to using data in innovative ways. The speed of integration and use also enables real-time data processing. This can enhance customer service, boost more efficient internal collaboration and innovation, and facilitate operational efficiency.
Using a cutting-edge, cloud-based data analytics framework offers your company the potential to store, access, and utilize all your data without reformatting, duplicating, or moving it around. Instead of having data spread out and in various incompatible formats, you can enter straight into analytics, innovations, and applications. This finally, will support an end-to-end view of the business and formulate an SSOT (Single Source Of Truth).
In an unpredictable business scenario when the customer demands and the requirements of the organization can alter immediately, a data analytics framework that enables you to boost on a dime is invaluable. That is exactly what you get with a cloud framework. This scalability can also boost cost savings. The tools that are utilized in more traditional analytics frameworks can be quite expensive and include rigid pricing structures, but cloud analytics solutions enable you to pay only for what you see.
There are various strategies for business analytics and numerous tools that support them, and the industry will evolve wider in the near future. Instances of key trends to watch include:
1. The sector for self-servicing reporting prevails to expand as more business users grow their inclination towards taking advantage of analytics without requiring the expertise of a data scientist, engineer, or analyst.
2. Deep learning, which is the advanced form of ML (Machine Learning) based on a multi-layer neural network, will slowly increase as more companies attain the resources required to support their computations.
3. Researchers anticipate the adoption of data fabric ideas to increase because of rising interest in real-time streaming analytics.
Data teams should keep a track of these and other developments and evaluate whether they should adopt their data analytics frameworks and architectures to accommodate them.
Data analytics frameworks are crucial to all large-scale data management and optimization efforts. These frameworks combine effective processes with cutting-edge data technologies to formulate insight and effective strategies for the operations of the companies.
The 5 types of data analytics include Descriptive Analytics, Diagnostic Analytics, Predictive Analytics, Prescriptive Analytics, and Cognitive Analytics.
The top 3 best data analytics framework types include TensorFlow, Scikit-learn, and Keras.
Team Jul 20, 2022 No Comments

Data analytics is all about collecting and analyzing raw data to find valuable patterns and insights that answer questions or solve problems. This helps businesses make smart decisions, improve efficiency, increase customer satisfaction, and drive more revenue.
If you want to master data analytics, you must know the different types of data analytics employed in industries. So, in this post, we will discuss the four main data analytics types in detail with examples. You will understand what they are, how they differ from each other, and why they are important.
There are four main types of data analytics: descriptive, diagnostic, predictive, and prescriptive analytics. Each of them answers a certain question that helps businesses better understand the past, present, and future and take smart actions to achieve their goals. Let’s understand them in detail:
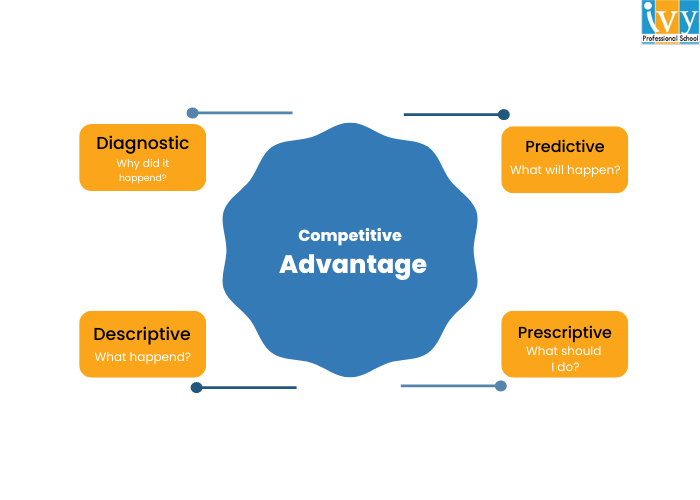
Descriptive analytics is the most basic type of data analytics currently used. It analyzes historical data to find out what has happened in the past or what is happening in the present.
It uses various techniques such as data aggregation, data mining, and reporting to spot patterns and trends over time. It may use arithmetic means to show an average of the values or frequency distribution to show how often a value occurs in the dataset.
Descriptive analytics uses visualization techniques like creating charts and graphs to visually represent complex data, making it easy to identify trends.
Examples of Descriptive Analytics
Let’s say you run an online store, and you want to know how much you sold in the last six months. So, you will use descriptive analytics to analyze monthly sales data and find peak sales periods and underperforming months. You can also identify top-selling products.
Similarly, businesses can use descriptive analytics to analyze:
Diagnostic analytics helps us go further than descriptive analytics. Now that we already know what has happened, diagnostic analytics helps us answer the valuable question, “Why did it happen?” That means we understand the cause of the trends and patterns we just found in the descriptive analytics.
You may use different methods like drill-down analysis, correlation analysis, Pareto analysis, fishbone diagram, hypothesis testing, etc., to effectively understand the cause of an event. This way, businesses can identify areas of improvement and make better strategies.
Examples of Diagnostic Analytics
Let’s say in the above sales report, you found that a particular month had significantly low sales. So, you use diagnostic analysis and find the cause: you had low product stock and couldn’t meet the customer demand effectively.
Similarly, businesses may use diagnostic analytics to find out:
When you know the problem and why it’s happening, you will be able to find effective solutions to make things better. Now, let’s move to our third type of data analytics:
Related: Data Scientist vs. Data Analyst
Now, we are getting into advanced analysis. Predictive analytics uses historical data, statistical models, and machine learning algorithms to figure out what may happen in the future. It can predict future events, trends, outcomes, and behaviors that may affect the business performance.
Techniques used in this type of data analytics can be time series analysis to identify patterns, regression analysis to identify relationships between variables, or decision trees to represent the decision-making process and predict outcomes. The idea is that once you know what will happen, you can better prepare for the challenges and get ready to take advantage of opportunities.
Examples of Predictive Analytics
Coming back to our online store example, let’s say you found that you had low sales because of an inventory shortage. Now you want to fix this problem. So, you may use predictive analytics to forecast the demand for various products. This way, you can have optimal inventory levels to meet the demand, avoiding inventory shortage as well as overstocking.
Predictive analytics can also be used to:
This is the most advanced type of data analysis that combines descriptive, diagnostic, and predictive analytics. It helps us find out what actions we should take to avoid an undesirable outcome or achieve a desirable outcome.
So, the goal of prescriptive analysis is to provide actionable recommendations. It may use techniques like optimization modeling to find the best solution with given constraints, simulation to evaluate different scenarios, or artificial intelligence techniques to automate decision-making processes.
Examples of Prescriptive Analytics
You used predictive analytics to find the demand forecasts. Now, prescriptive analytics goes further by recommending specific actions to achieve the maximum sales. It suggests how to optimize inventory based on predicted demand, supply chain factors, and business goals. You will also know how much inventory to order and when to order it.
You can also use prescriptive analytics to find actionable insights for these questions:
Now you know the four types of data analytics and how they depend on each other. The goal of data analytics is to help businesses identify areas for improvement, increase efficiency, and enhance processes. That’s why data analysts are in demand in the current industry.
If you want to be a data analyst, you can join Ivy Professional School’s Data Analytics Certification course. This is a live online program taught by industry professionals from IIT, IIM, and US universities. You will learn to use tools like Excel, SQL, Python, R, and Tableau with 50+ assignments, 30+ case studies, & 10+ industry projects. Visit this course page to learn more about it.

Eeshani Agrawal holds an MS in Civil Engineering from Texas A&M University (USA) and has over 16 years of experience in data visualization, storytelling, and analytics. She has consulted for top engineering, manufacturing, and consulting firms worldwide and has coached over 9,000 professionals and students from leading institutions like IITs, IIMs, and ISI.
UsernamE Aug 15, 2021 No Comments
What is R?
R is a programming language that comes long back from 1995. Created by Ross Ihaka and Robert Gentleman at the Auckland University, New Zealand, R is an open-source language that extends its uses for statisticians and data scientists. They are the ones who create and develop applications based on statistics and
UsernamE Jul 30, 2021 No Comments
Artificial intelligence(AI) and Data Science are ready to transform our unimaginable lives years ago. For that reason, Data Science and Artificial Intelligence have become the “trending topics” in every article of 2021. While everyone is able to interpret the actual reason for the wave of such a lucrative job
Anubinda Jul 12, 2021 No Comments
Anubinda Jun 18, 2021 No Comments
Dr. Regi Mathew, a fellowship, PhD holder from IIM Ahmedabad, has extensive experience of 20+ years in the data analytics domain. In addition to that, his data science and analytics journey also includes con