
Prateek Agrawal Aug 29, 2026 No Comments

If you have been researching data careers, chances are you have typed “best data engineering course with placement” into Google more than once. That is a good instinct, data engineering has quietly become one of the highest-paying, most stable roles in the Indian tech industry, and picking the right program can make or break how quickly you land your first job in the field. In this guide, we will break down exactly what to look for, what a strong curriculum should include, and how a placement-focused program can take you from beginner to hired data engineer.
Data engineers build and maintain the pipelines, warehouses, and infrastructure that allow organizations to collect, clean, and use data at scale. Every dashboard a business analyst opens, every machine learning model a data scientist trains, and every recommendation engine an e-commerce site runs depends on a data engineer having built reliable systems behind the scenes.
As Indian companies — from fintech startups to global capability centers — accelerate their adoption of cloud computing, real-time analytics, and generative AI, the demand for skilled data engineers has surged well beyond the supply of qualified professionals. Job portals consistently list data engineering among the fastest-growing tech roles, and salaries have risen accordingly. This gap between demand and skilled supply is precisely why so many career switchers and freshers are now searching for the best data engineering course with placement rather than trying to piece together skills through scattered YouTube tutorials.
The catch is that data engineering is not a “watch a few videos and you’re job-ready” kind of field. It requires structured learning across programming, databases, distributed systems, cloud platforms, and orchestration tools — which is exactly why a well-designed, mentor-led course with genuine placement support matters so much.
Not every course that advertises “placement assistance” delivers on it. Before enrolling, evaluate a program against these criteria:
When you filter your shortlist using these six criteria, you naturally narrow down to programs that can genuinely call themselves the best data engineering course with placement — as opposed to marketing copy dressed up as a guarantee.

A placement-ready data engineering curriculum should be built in layers, moving from fundamentals to production-grade systems:
A course missing several of these layers is unlikely to prepare you for real interviews, regardless of how it markets itself. This is the benchmark to hold any program to when you’re comparing options for the best data engineering course with placement.
At Ivy Pro School, the data engineering program is designed around exactly the curriculum layers above, taught by practitioners rather than purely academic instructors. A few things set the program apart:
Combine institutional pedigree with a genuine placement engine, and you get a program that doesn’t just teach data engineering concepts — it engineers outcomes. That combination of curriculum depth, mentorship, and accountability is what makes this the best data engineering course with placement for learners who are serious about breaking into the field, whether they’re fresh graduates or working professionals pivoting from adjacent roles like software development, QA, or business analytics.

The phrase “placement assistance” gets used loosely across the ed-tech industry, so it’s worth understanding what genuine placement support actually looks like:
This is the layer that separates a course from a career transition. Plenty of programs teach Spark and Airflow reasonably well; far fewer put in the structural work to get you hired afterward. Spend as much time scrutinizing this section of a program as you do the technical syllabus, since it is usually the deciding factor between a completed certificate and an actual job offer.
Even motivated learners waste months and money by making avoidable mistakes during the selection process:
Avoiding these pitfalls up front saves both time and tuition, and it usually points you straight toward programs with a genuine track record of outcomes rather than marketing promises.

Data engineering offers several career trajectories once you have foundational skills in place:
Salaries in this field have grown steadily as demand has outpaced the supply of trained professionals, with entry-level data engineers in India commanding competitive packages compared to many other tech roles, and experienced engineers with cloud and big data expertise commanding significantly higher compensation. This growth trajectory is a major reason so many professionals are actively pursuing structured training instead of relying on self-study alone — the field rewards demonstrable, hands-on expertise, and employers pay a premium for candidates who can prove it through real pipeline projects and credible certification rather than a list of watched tutorials.
Beyond base salary, data engineers often see faster promotion cycles than adjacent roles, since the skill set transfers directly into senior positions like data architect, platform lead, or engineering manager for data infrastructure teams. Companies also increasingly value data engineers who understand the basics of machine learning workflows, since MLOps and AI infrastructure roles are growing out of traditional data engineering teams as generative AI adoption accelerates across industries.
Both formats can lead to the same outcome, but they suit different learners:
Classroom or hybrid learning works well if you value in-person mentorship, peer accountability, and a structured daily routine — which is why Ivy Pro School maintains physical centers in Kolkata, Bangalore, and Delhi alongside its online offering.
Live online learning works well for working professionals who need flexibility around existing job commitments but still want real-time instructor interaction rather than pre-recorded, self-paced content.
What matters more than the format is whether the program includes live doubt-clearing sessions, project reviews, and direct placement support — self-paced, pre-recorded courses with no human accountability structure rarely deliver strong placement outcomes, regardless of how comprehensive the video library looks on paper.
Recruiters screening resumes for data engineering roles tend to look for a specific, recognizable toolkit, and a strong course should give you working proficiency — not just theoretical familiarity — across most of the following:
A program that only teaches two or three items from this list will leave graduates under-prepared for technical interviews, where hiring managers routinely test candidates on how these tools interact rather than testing each one in isolation. This is also why capstone projects matter so much — they force learners to combine several of these tools into a single working pipeline, which is a far closer approximation of real job responsibilities than isolated exercises ever could be.
Q: How long does it take to complete a data engineering course with placement? Most structured programs run between 6 and 9 months, depending on whether you’re studying full-time or alongside a job, with placement support typically continuing for several months after course completion.
Q: Do I need a coding background to enroll? No. A good program builds programming and SQL skills from the ground up, though basic logical reasoning and comfort with computers will help you move faster through the early modules.
Q: Is data engineering harder to break into than data science? Not necessarily — it’s a different skill set, more focused on systems, pipelines, and infrastructure than statistics and modeling. Many learners find the more engineering-oriented, less mathematically heavy curriculum easier to grasp.
Q: What makes Pay After Placement different from a regular fee structure? It shifts financial risk away from the learner and ties the institute’s revenue directly to your getting placed, which tends to correlate with stronger, more hands-on placement support.
Q: Can working professionals switch careers into data engineering? Yes — professionals from software development, QA, database administration, and even business analytics backgrounds frequently transition into data engineering roles, often bringing relevant domain knowledge that strengthens their candidacy.
Q: Which cloud platform should I learn first for data engineering? Most learners start with AWS, since it has the largest market share in India’s hiring landscape, though a strong program will expose you to the core concepts of Azure and GCP as well, since many enterprises run multi-cloud environments.
Q: Does Ivy Pro School offer both classroom and online batches for data engineering? Yes — the program runs at physical centers in Kolkata, Bangalore, and Delhi, alongside live online batches for learners who need remote flexibility while keeping real-time instructor interaction and doubt-clearing support.
Choosing the best data engineering course with placement comes down to three things: a curriculum that genuinely covers the tools employers use, instructors who have worked with those tools in production, and a placement system that goes far beyond a vague promise in the brochure. Ivy Pro School’s data engineering program combines all three — an 18-year institutional track record, NASSCOM and IBM industry partnerships, and a Pay After Placement model designed to keep the institute accountable for your outcome, not just your attendance.
If you’re serious about building a career in data engineering, it’s worth attending a free career counseling session at Ivy Pro School’s Kolkata, Bangalore, or Delhi centers, or joining a live online orientation, to see the curriculum, meet instructors, and understand exactly how the placement process works before you commit.
Prateek Agrawal Aug 08, 2026 No Comments
Prateek Agrawal Aug 01, 2026 No Comments
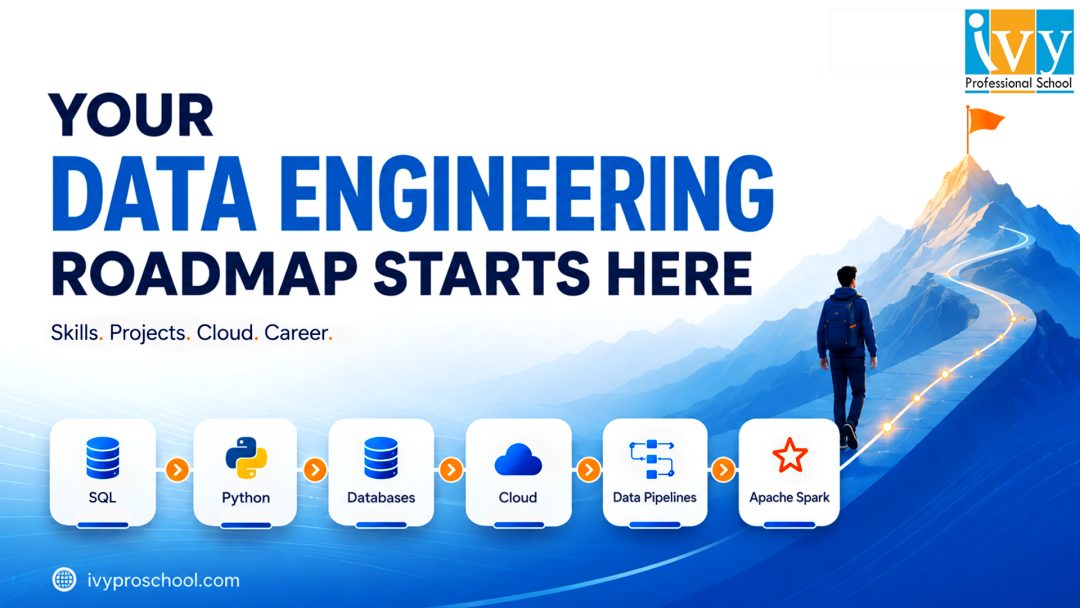



Prateek Agrawal Jul 18, 2026 No Comments
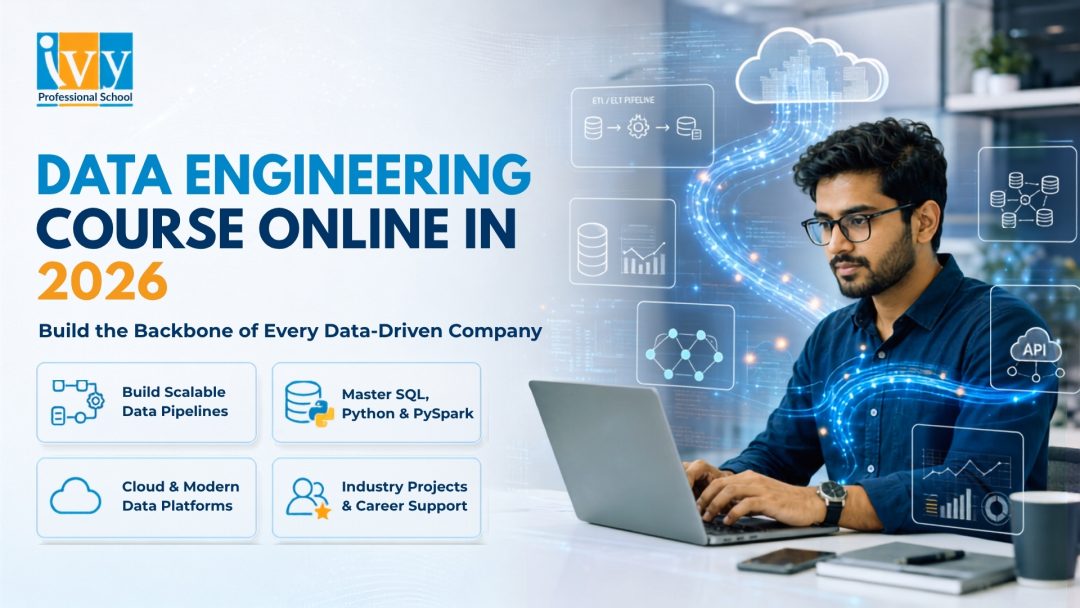
The demand for skilled data engineers has never been stronger, and finding the right data engineering course online in 2026 is the smartest first step you can take toward this high-paying, high-growth career. India alone is projected to need over 11 lakh data professionals by 2026, and data engineers sit at the very top of that hiring list. Whether you are a fresh graduate, a software developer looking to pivot, or a data analyst ready to level up, a data engineering course online in 2026 gives you the flexibility to build industry-relevant skills without pausing your life. This guide covers everything, what data engineering actually is, what to learn, which tools matter, and how to land your first role.
Before choosing a data engineering course online in 2026, it helps to understand what the job actually involves. Data engineers are the architects of the data world. They design, build, and maintain the pipelines, systems, and infrastructure that move data from where it originates to where it can be analysed and used.
Think of it this way: a data scientist cannot build a machine learning model without clean, well-structured data. A business analyst cannot generate accurate reports without reliable pipelines feeding the right numbers into the right dashboards. Data engineers are the professionals who make all of that possible.
In 2026, the role has expanded significantly. Modern data engineers are not just writing SQL queries and building ETL pipelines — they are deploying real-time streaming systems, managing cloud data warehouses at petabyte scale, orchestrating complex workflows, and increasingly working alongside AI systems that demand consistent, high-quality data inputs.
The average salary for a data engineer in India ranges from ₹8 LPA at the entry level to ₹30 LPA or more for experienced professionals — making it one of the most financially rewarding technical careers available to Indian graduates today.
Not all programmes are equal. A strong data engineering course online in 2026 should go well beyond the basics and prepare you for the tools and workflows that real employers are actually using. Here is what to look for:
Every credible data engineering course online in 2026 begins with Python and SQL — the two languages that form the foundation of all data engineering work.
Python is used for writing data pipelines, automating workflows, interacting with APIs, and building ETL (Extract, Transform, Load) scripts. Key libraries to learn include:
SQL remains the lingua franca of data. You should be comfortable with:
Building pipelines is the core of data engineering work. A solid data engineering course online in 2026 will teach you how to design and implement pipelines that extract data from multiple sources, transform it into usable formats, and load it into target systems reliably and efficiently.
You should learn both batch processing (scheduled jobs that run at set intervals) and real-time streaming (continuous data flows that process events as they happen). Tools covered should include:

In 2026, virtually all enterprise data infrastructure runs on the cloud. A data engineering course online in 2026 that does not cover cloud platforms is leaving you underprepared for the job market. The three major clouds you should understand are:
You do not need to master all three. Most programmes recommend starting with one cloud platform deeply and developing familiarity with the others. AWS and GCP are the most in-demand in India’s data engineering job market in 2026.
Modern data infrastructure has evolved beyond traditional data warehouses. A high-quality data engineering course online in 2026 will teach you about:
Understanding when to use each architecture — and how to design data models that serve both operational and analytical needs — is a critical skill that separates strong data engineers from average ones.
Good data engineering is not just about moving data — it is about structuring it intelligently. A rigorous data engineering course online in 2026 covers:
A data engineering course online in 2026 should give you hands-on experience with pipeline orchestration — the practice of scheduling, monitoring, and managing complex multi-step workflows. Apache Airflow is the industry standard, but in 2026 you should also be aware of:
Professional data engineers do not work in isolation. They collaborate using the same software engineering practices as developers. A well-rounded data engineering course online in 2026 includes:
One of the fastest-growing areas in data engineering is real-time data processing. Consumer apps, financial systems, logistics platforms, and IoT devices all generate continuous streams of data that must be processed instantly. A forward-looking data engineering course online in 2026 will cover:

With dozens of platforms and hundreds of programmes available, selecting the right data engineering course online in 2026 requires careful evaluation. Here is what to assess:
The tools in data engineering evolve rapidly. Check that the data engineering course online in 2026 you are considering covers current tools — dbt, Delta Lake, Kafka, modern cloud services — not legacy technologies from five years ago. Ask the provider when the curriculum was last updated.
A data engineering course online in 2026 should be project-heavy. Look for programmes that have you building end-to-end pipelines on real datasets — ingesting raw data from APIs or databases, processing it through transformation layers, loading it into a cloud data warehouse, and orchestrating the workflow with Airflow. Employers want to see working pipelines in your portfolio, not just certificate screenshots.
Online learning can feel isolating without the right support structure. The best data engineering course online in 2026 will include live doubt-clearing sessions, peer cohorts, code review from experienced data engineers, and access to an alumni community that can refer you to job openings.
Look for programmes that offer resume reviews, mock technical interviews, and direct connections to hiring partners. The ideal data engineering course online in 2026 treats placement as a core deliverable — not an afterthought — because completing the course is only valuable if it translates into a job offer.
A serious data engineering course online in 2026 typically runs 6–10 months for working professionals studying part-time. Accelerated bootcamps can cover the material in 3–4 months with full-time commitment. Be realistic about your available hours per week before enrolling.

Completing the right data engineering course online in 2026 opens doors to several well-defined and well-compensated roles:
After completing a data engineering course online in 2026, you will find demand across virtually every sector:
Certificates from a data engineering course online in 2026 matter far less than the proof you can actually do the work. Here are portfolio projects that will impress interviewers:
Each project should be documented on GitHub with a clear architecture diagram, README, and notes on design decisions. A well-presented portfolio from a data engineering course online in 2026 can outweigh a postgraduate degree in data-related hiring decisions.
Supplement your primary programme with these high-quality free resources:
Skipping the fundamentals. Many learners jump straight to Spark and Kafka without mastering Python and SQL first. Every strong data engineering course online in 2026 is built on these foundations — do not rush past them.
Learning tools instead of concepts. Tools change; architectural thinking does not. Understand why you use a data lake versus a warehouse, why you choose streaming over batch — not just how to configure a specific tool.
Not building in public. Share your projects on LinkedIn and GitHub as you build them. The data engineering community in India is active and supportive, and visibility often leads directly to interview opportunities.
Ignoring data quality. Real pipelines break, data arrives late, schemas change unexpectedly. A serious data engineering course online in 2026 will teach you data validation, monitoring, and alerting — skills that separate production-ready engineers from hobbyists.
Underestimating soft skills. Data engineers collaborate closely with data scientists, analysts, product managers, and infrastructure teams. Communication, documentation, and the ability to translate technical decisions into business language are essential alongside technical proficiency.
Data engineering is the backbone of the modern data economy, and 2026 is an exceptional time to enter the field. The right data engineering course online in 2026 gives you the skills, tools, portfolio, and industry connections to compete for roles that pay well, grow fast, and sit at the heart of every data-driven organisation.
Be intentional about your choice. Look for a data engineering course online in 2026 that is current, hands-on, mentor-supported, and placement-focused. Build real pipelines. Document your work. Engage with the data engineering community. And remember — the best data engineers are not just technical experts; they are problem-solvers who understand that their job is to make data work reliably for the people who depend on it.
Your data engineering journey starts with one decision. Make it the right one.

Prateek Agrawal Jul 04, 2026 No Comments
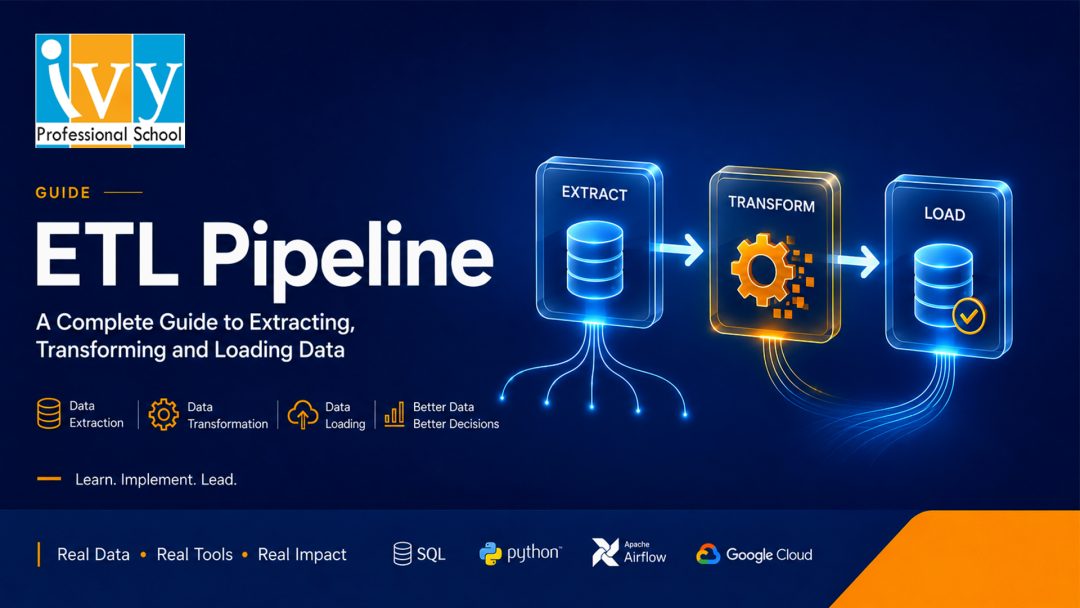
Modern organisations generate data from websites, mobile applications, business software, sensors, customer interactions, financial systems, and cloud platforms. However, collecting data is only the beginning. Before organisations can analyse this information, generate reports, build machine learning models, or make informed decisions, the data must be extracted, cleaned, organised, and moved to a suitable destination.
This process is commonly managed through an ETL pipeline.
An ETL pipeline provides a structured method for moving data from multiple source systems into a centralised data warehouse, database, data lake, or analytics platform. It ensures that raw information is converted into accurate, consistent, and usable data.
In this comprehensive guide, we will explain what an ETL pipeline is, how it works, its key components, benefits, challenges, architecture, use cases, tools, best practices, and how it differs from other data integration approaches.
An ETL pipeline is an automated data workflow that extracts data from one or more sources, transforms it into a required format, and loads it into a target system.
ETL stands for:
Each stage performs a specific function in the data integration process.
The primary objective of an ETL pipeline is to convert fragmented and inconsistent source data into reliable information that can be used for reporting, analytics, business intelligence, artificial intelligence, and operational decision-making.
For example, a retail company may collect data from:
An ETL pipeline can extract data from all these systems, standardise the information, remove duplicates, calculate required metrics, and load the final dataset into a cloud data warehouse.
Business users can then analyse revenue, product performance, inventory levels, customer behaviour, campaign effectiveness, and profitability from a single source of truth.
Business data is rarely generated in a clean and consistent format. Different systems may use different field names, date formats, currencies, customer identifiers, product codes, and data structures.
Without a proper ETL pipeline, analysts may spend significant time manually collecting, cleaning, and combining data before they can perform any meaningful analysis.
An effective ETL pipeline helps organisations:
The ETL pipeline acts as a bridge between raw operational data and business-ready analytical data.
An ETL pipeline operates through three main stages: extraction, transformation, and loading.
The extraction stage involves retrieving data from one or more source systems.
Common data sources include:
The extraction process must retrieve data without negatively affecting the performance of the source application.
There are several extraction methods.
In full extraction, the ETL pipeline retrieves the entire dataset during every run.
This method is relatively simple but can become inefficient when working with large datasets. It may also increase network usage, processing time, and infrastructure costs.
Full extraction is generally suitable for smaller datasets or systems where incremental tracking is unavailable.
Incremental extraction retrieves only the records that have been added or modified since the previous ETL pipeline run.
This method is more efficient and is commonly used in production environments.
Incremental extraction may rely on:
Real-time extraction continuously captures new or updated data as events occur.
This approach is useful for scenarios such as fraud detection, operational monitoring, recommendation engines, stock tracking, and customer activity analysis.
The transformation stage converts extracted data into a clean, consistent, and business-ready format.
This is often the most complex part of an ETL pipeline because source data may contain errors, inconsistencies, missing values, duplicated records, or incompatible structures.
Common transformation activities include:
Data cleaning identifies and corrects inaccurate or incomplete records.
Examples include:
Data standardisation converts values into a consistent format.
For example:
Validation ensures that data complies with predefined rules.
Examples include:
Aggregation summarises detailed records into higher-level metrics.
An ETL pipeline may calculate:
Filtering removes records that are not required for the target system.
For example, an organisation may exclude:
Data enrichment adds new information to existing records.
For example, a company may enrich customer data by adding:
Data joining combines related datasets using common fields.
For example, order data may be joined with:
The transformation stage should follow clearly defined business rules. These rules must be documented, tested, and regularly reviewed.
The loading stage transfers transformed data into the target system.
Common ETL pipeline destinations include:
There are two common loading methods.
A full load replaces or reloads the entire target dataset.
This may be appropriate for smaller datasets, reference tables, or initial data migrations.
An incremental load adds or updates only the records that have changed.
This approach reduces processing time and is more suitable for large-scale, recurring ETL pipeline operations.
The loading stage may also apply rules for:

A typical ETL pipeline architecture contains several connected layers.
The source layer contains the original systems from which data is collected.
These may include operational databases, software applications, files, APIs, and external platforms.
The staging layer is a temporary storage area where extracted data is placed before transformation.
It allows the ETL pipeline to:
The transformation layer applies business rules, validation checks, calculations, mappings, and cleaning operations.
This layer is responsible for converting raw information into a structured and usable dataset.
The target layer stores the processed data.
Depending on the use case, the target may be a data warehouse, database, reporting system, data lake, or machine learning platform.
This layer manages scheduling, dependencies, logging, alerts, retries, and pipeline execution.
It ensures that each ETL pipeline task runs in the correct sequence.
For example, a sales transformation process should not begin until customer, product, and transaction data have been successfully extracted.

ETL pipelines can process data in batches or in real time.
A batch ETL pipeline processes data at scheduled intervals.
It may run:
Batch processing is commonly used for:
Batch ETL is generally simpler and less expensive to implement.
A real-time ETL pipeline processes data continuously or within a very short interval after an event occurs.
Real-time processing is useful for:
Real-time ETL pipelines require more sophisticated architecture, monitoring, and infrastructure than batch pipelines.
The correct approach depends on the organisation’s data volume, business requirements, latency expectations, and budget.
ETL and ELT are both data integration methods, but the order of transformation and loading differs.
In an ETL pipeline:
In an ELT pipeline:
ELT has become increasingly common with cloud data warehouses because these platforms provide scalable computing resources.
An ETL pipeline may be preferable when:
ELT may be preferable when:
Many organisations use a combination of ETL and ELT depending on the specific use case.
An ETL pipeline can support a wide range of business and technical requirements.
ETL pipelines prepare data for dashboards, scorecards, and management reports.
For example, data from sales, finance, operations, and marketing systems can be consolidated into a business intelligence platform.
Organisations often store customer information across multiple systems.
An ETL pipeline can combine:
This creates a unified customer view.
ETL pipelines are frequently used when organisations move data from legacy systems to new applications or cloud platforms.
The pipeline can map old fields to new structures, validate records, and identify migration errors.
Machine learning models require clean and consistent training data.
An ETL pipeline can prepare features, remove invalid records, standardise values, and create labelled datasets.
Finance teams can use ETL pipelines to combine data from accounting systems, bank statements, payment platforms, billing applications, and enterprise systems.
This supports profitability analysis, cash flow reporting, budgeting, and forecasting.
An ETL pipeline can create auditable data flows for regulatory reporting.
It can also mask sensitive information, validate mandatory fields, maintain historical records, and generate processing logs.
Marketing teams can consolidate information from advertising platforms, CRM tools, email campaigns, social media systems, and website analytics.
This helps measure campaign performance, cost per lead, attribution, customer acquisition cost, and return on marketing investment.
Organisations can build an ETL pipeline using commercial platforms, open-source tools, cloud services, or custom code.
Common categories include:
Cloud providers offer managed data integration services that support scheduling, connectors, transformations, monitoring, and scalability.
These services are suitable for organisations already operating within a specific cloud ecosystem.
Enterprise ETL platforms provide graphical interfaces, governance features, metadata management, security controls, and extensive system connectors.
They are often used by large organisations with complex integration requirements.
Open-source tools offer flexibility and lower licensing costs.
However, they may require more technical expertise for deployment, maintenance, monitoring, and scaling.
Data engineering teams may build custom pipelines using programming languages such as Python, Java, or SQL.
Custom development provides greater control but increases responsibility for testing, documentation, monitoring, security, and maintenance.
When selecting an ETL pipeline tool, organisations should evaluate:
A properly designed ETL pipeline provides several business and technical benefits.
The pipeline applies consistent validation and cleaning rules, reducing errors in reports and analytical models.
Manual data preparation tasks can be automated, allowing analysts to spend more time interpreting information.
Reliable and timely data enables business teams to make decisions more quickly.
An ETL pipeline helps ensure that departments use the same definitions for revenue, profit, active customers, conversion rates, and other metrics.
Modern ETL pipelines can process increasing data volumes as an organisation grows.
Processing rules, data ownership, lineage, access controls, and audit logs can be incorporated into the ETL pipeline.
The pipeline connects isolated applications and creates a unified analytical environment.

Despite its benefits, developing and maintaining an ETL pipeline can be difficult.
Missing values, duplicate records, inconsistent identifiers, and incorrect formats can create transformation errors.
A change in an API, database schema, file structure, or application field can cause the pipeline to fail.
Large joins, complex transformations, and high-volume data movement may increase execution time.
Incorrect incremental logic can load the same records multiple times.
A pipeline should be able to recover from partial failures without reprocessing unnecessary data.
Without proper logs and alerts, failures may remain undetected until users notice missing or incorrect reports.
Transformation logic can become difficult to manage when business definitions are unclear or frequently changing.
ETL pipelines may process confidential customer, employee, financial, or operational data. Weak access controls can expose sensitive information.
A reliable ETL pipeline should be designed for accuracy, maintainability, scalability, and failure recovery.
Before building the pipeline, clarify:
Avoid full extraction and loading when only a small portion of the data changes.
Incremental processing improves efficiency and reduces infrastructure usage.
Include validation rules at multiple stages of the ETL pipeline.
Checks may include:
Data lineage documents where data originated, how it was transformed, and where it was loaded.
This is essential for troubleshooting, governance, and compliance.
Every pipeline run should capture:
Alerts should notify the appropriate team when failures or unusual conditions occur.
An idempotent ETL pipeline can be rerun without creating duplicate or inconsistent results.
This is particularly important when recovering from failures.
Database connections, file paths, API endpoints, scheduling details, and environment settings should be managed through configuration files or secure environment variables.
Apply encryption, masking, tokenisation, access controls, and secure credential management.
Sensitive fields should only be available to authorised users.
Testing should include:
Every important transformation should have a documented business definition.
This reduces confusion and makes future maintenance easier.
Building an ETL pipeline usually involves the following steps.
List the databases, applications, files, APIs, and platforms that contain the required data.
Determine where the processed data will be stored and how users will access it.
Define target tables, fields, relationships, keys, and historical tracking requirements.
Decide whether the pipeline will use full, incremental, or real-time extraction.
Document cleaning, mapping, aggregation, enrichment, validation, and calculation requirements.
Use an ETL platform, cloud service, orchestration tool, SQL scripts, or programming language to implement the workflow.
Create processes for rejected records, retries, partial failures, and notifications.
Compare source and target data to ensure completeness and accuracy.
Deploy the ETL pipeline into the production environment and configure the required schedule.
Track performance, failure rates, processing time, data quality, and infrastructure consumption.
As data volumes increase, ETL pipeline performance becomes increasingly important.
Common optimisation techniques include:
Performance tuning should focus on the complete pipeline rather than one isolated component.
The ETL pipeline remains a core component of modern data engineering.
Although technologies and architectures continue to evolve, organisations still need dependable processes for collecting, cleaning, transforming, and delivering data.
Modern ETL pipelines increasingly support:
The focus is shifting from simply moving data to building observable, governed, resilient, and reusable data products.
An ETL pipeline is a process that collects data from different sources, cleans and restructures it, and moves it into a system where it can be analysed.
The three stages are extraction, transformation, and loading.
No. An ETL pipeline can load data into databases, data lakes, analytics platforms, machine learning systems, and business applications.
Yes. Python is widely used for custom ETL development because it supports data processing, database connectivity, APIs, automation, and workflow integration.
A data pipeline is a broader term for any automated movement or processing of data. An ETL pipeline is a specific type of data pipeline that follows the extract, transform, and load sequence.
The frequency depends on business requirements. A pipeline may run monthly, daily, hourly, every few minutes, or continuously.
A reliable ETL pipeline includes automated validation, monitoring, logging, error handling, retry mechanisms, secure access, documentation, and clear recovery procedures.
An ETL pipeline is essential for converting raw, fragmented data into accurate and actionable information. It extracts data from multiple sources, applies cleaning and transformation rules, and loads the results into a centralised target system.
A well-designed ETL pipeline improves data quality, reduces manual effort, supports consistent reporting, and enables business intelligence, machine learning, operational analytics, and regulatory reporting.
However, creating an effective pipeline requires more than connecting source and target systems. Organisations must carefully define business rules, implement data quality checks, monitor failures, protect sensitive information, optimise performance, and document the complete data flow.
As businesses generate greater volumes of information, the ETL pipeline will continue to play a critical role in modern data architecture. Organisations that build scalable, secure, and observable ETL workflows will be better positioned to use their data for faster decisions, improved efficiency, and long-term competitive advantage.
Prateek Agrawal Jun 27, 2026 No Comments
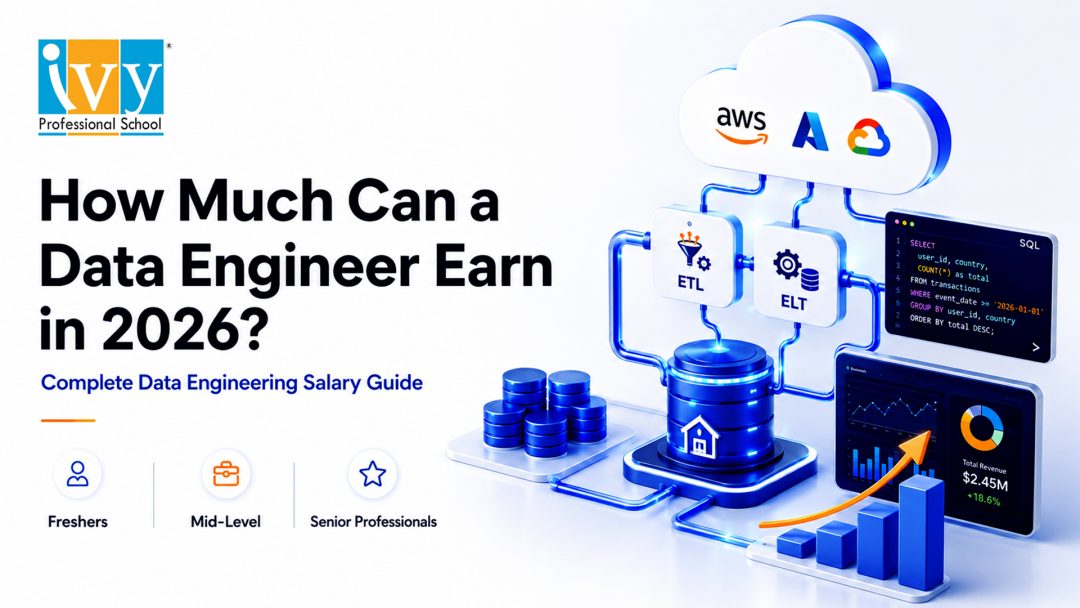
The average data engineering salary in India is approximately ₹10 lakh per year. However, actual salaries can range from around ₹4 lakh per year for freshers to more than ₹40 lakh per year for experienced data engineers, data architects and engineering leaders.
The data engineering salary offered by an organisation depends on several factors, including the candidate’s experience, technical skills, educational background, industry, location and ability to work with modern cloud-based data platforms.
A professional who knows basic SQL and Python may start with a moderate package. In comparison, someone who can build scalable cloud pipelines, manage distributed data-processing systems and design enterprise data platforms can command a substantially higher data engineering salary.
| Experience Level | Indicative Annual Salary |
| Fresher or entry-level professional | ₹4–8 lakh |
| 2–4 years of experience | ₹7–14 lakh |
| 5–8 years of experience | ₹14–25 lakh |
| 8 or more years of experience | ₹22–40 lakh or more |
| Data architect or engineering leader | ₹30–60 lakh or more |
These figures are broad market estimates. Product companies, global capability centres, fintech organisations and high-growth technology companies may offer compensation above these ranges.
The data engineering salary is increasing because companies are generating more data than ever before.
Businesses collect information through websites, mobile applications, customer transactions, enterprise resource planning systems, marketing platforms, connected equipment and social media channels. This data must be collected, cleaned, integrated, stored and made available before it can support business decisions.
Data engineers build the infrastructure that makes this possible.
Their work supports:
Organisations may employ data analysts and data scientists, but these professionals cannot work effectively without reliable data pipelines. This dependency has increased the importance of data engineers and contributed to the growth of the data engineering salary across industries.
Data engineering also requires a combination of skills that is not always easy to find. Employers need professionals who understand programming, databases, cloud infrastructure, distributed computing, security, governance and business requirements.
This combination of technical depth and operational responsibility makes data engineering one of the better-paid career options within the broader data and analytics domain.

The typical data engineering salary for freshers in India ranges from approximately ₹4 lakh to ₹8 lakh per year.
Candidates from recognised engineering institutions, applicants with relevant internships and professionals who have completed practical cloud projects may receive higher offers. Some premium product companies and global technology organisations may offer entry-level packages above ₹10 lakh per year.
A fresher’s starting package depends on several important factors.
SQL is one of the most important skills for an entry-level data engineer. Candidates should be comfortable with:
Freshers who can solve realistic business problems using SQL may qualify for a better data engineering salary than candidates who know only basic commands.
Python is widely used for pipeline development, data transformation, automation, validation and API integration. Knowledge of Java or Scala may also be valuable, particularly in organisations using Apache Spark.
A candidate does not need to be an advanced software engineer at the beginning of the career. However, the ability to write clean, reusable and well-structured code can improve employment opportunities.
Completing online courses is useful, but employers increasingly look for practical evidence of capability.
A strong beginner-level project may involve:
Candidates who can explain the complete architecture of such a project may negotiate a stronger data engineering salary.

Entry-level professionals should develop practical familiarity with at least one cloud platform:
Even basic experience with cloud storage, pipeline orchestration and data warehouses can strengthen a fresher’s profile.
An internship involving SQL, Python, cloud platforms, business intelligence or backend development can improve employability. It demonstrates that the candidate understands how data systems work in a professional environment.
Freshers should not evaluate a role only by its initial compensation. A lower-paying position that provides exposure to Spark, Databricks, Snowflake or Azure Data Factory may create better long-term growth than a higher-paying role restricted to repetitive manual tasks.
Experience is one of the biggest determinants of compensation. However, the quality and relevance of the experience are more important than the number of years alone.
The data engineering salary for an entry-level professional generally ranges from ₹4 lakh to ₹9 lakh per year.
Common responsibilities include:
At this stage, professionals should focus on building strong foundations in SQL, Python, data warehousing and cloud technologies.
The data engineering salary for a mid-level professional generally ranges from ₹8 lakh to ₹18 lakh per year.
Mid-level engineers are expected to work independently and take responsibility for complete workflows. Their responsibilities may include:
Professionals who can work with Spark, Databricks, Kafka, Snowflake or modern cloud services are often positioned toward the upper end of the salary range.
The data engineering salary for a senior professional typically ranges from ₹15 lakh to ₹30 lakh per year.
Senior data engineers are expected to make architecture decisions, manage technical risks and guide junior team members.
Their responsibilities frequently include:
At this level, communication, system design and stakeholder-management skills become as important as coding ability.
Lead data engineers, engineering managers and data architects may earn between ₹25 lakh and ₹50 lakh per year. Professionals working for premium global companies may receive even higher compensation.
At this level, the data engineering salary may include fixed pay, performance bonuses, stock options and retention incentives.
These professionals may be responsible for:
Location continues to influence salaries, although remote and hybrid roles have reduced some geographical differences.
Bengaluru generally offers some of the highest salaries in India because of its concentration of technology companies, global capability centres and startups.
The data engineering salary in Bengaluru may range from ₹7 lakh to ₹30 lakh per year, depending on experience and specialisation. Senior professionals working for product companies may earn substantially more.
Hyderabad has a strong presence of multinational technology companies, pharmaceutical organisations, financial-services firms and cloud development centres.
Data engineers in Hyderabad may earn approximately ₹6 lakh to ₹25 lakh per year.
Pune offers opportunities across IT services, automotive, manufacturing, banking and enterprise software.
The data engineering salary in Pune may range from approximately ₹5.5 lakh to ₹22 lakh per year.
Mumbai’s banking, fintech, consulting, insurance and media sectors create demand for professionals who can handle large and sensitive datasets.
Salaries may range from ₹6 lakh to ₹25 lakh per year, with premium opportunities available in banking and fintech.
Gurugram and Noida host consulting companies, ecommerce organisations, global capability centres and technology firms.
The data engineering salary in Delhi NCR may range from ₹6 lakh to ₹26 lakh per year.
Chennai offers data engineering opportunities in IT services, automotive, manufacturing, banking and software development.
Professionals may earn between ₹5 lakh and ₹22 lakh per year.
Data engineering opportunities in Kolkata are expanding across analytics, consulting, IT services and remote engineering teams.
While the local data engineering salary may sometimes be lower than salaries in Bengaluru or Gurugram, remote employment is giving professionals access to national and international opportunities.
Candidates should compare compensation with the cost of living, project quality, learning opportunities, work flexibility and long-term career potential.

A degree may help someone enter the profession, but long-term salary growth depends primarily on skills and business impact.
Data engineers must do more than retrieve information from tables. High-paying positions require the ability to:
Advanced SQL capability can directly influence the data engineering salary offered to a candidate.
Python is commonly used for pipeline development, automation, validation and API integration.
Java and Scala are particularly useful in large-scale Spark environments. Professionals who can write tested, maintainable and production-ready code generally earn more than those who depend entirely on visual or low-code tools.
Cloud capability is one of the strongest salary differentiators.
Valuable services include:
Developing deep expertise in one cloud environment can substantially improve a professional’s data engineering salary.
Apache Spark is used to process large datasets across distributed computing environments. Databricks provides a unified platform for data engineering, analytics and machine learning.
Engineers who can optimise Spark jobs, manage clusters and build lakehouse solutions are often eligible for premium compensation.
Employers value professionals who understand:
Knowledge of Snowflake, BigQuery, Redshift, Synapse or Microsoft Fabric can improve the data engineering salary available to a candidate.
Data pipelines must be scheduled, monitored and managed reliably.
Common orchestration tools include:
Professionals who understand dependencies, retries, alerts, logging and failure-handling mechanisms are particularly valuable in production environments.
Real-time data-processing skills can command premium salaries because streaming architectures are technically complex and often business-critical.
Relevant technologies include:
These systems are used in fraud detection, ecommerce personalisation, financial trading, connected manufacturing and operational monitoring.
Modern data engineers increasingly work with:
Data engineers who can deploy, test and monitor pipelines systematically may receive a higher data engineering salary.
Generative AI is increasing the demand for professionals who can build data pipelines for:
Data engineers do not necessarily need to become data scientists. However, understanding how data is prepared and delivered to artificial intelligence applications can create access to premium positions.
Some industries pay more because their data environments are larger, more regulated or closely connected to revenue generation.
| Industry | Salary Potential | Common Use Cases |
| Product technology | High | Customer platforms, AI and large-scale analytics |
| Banking and fintech | High | Transactions, fraud, risk and compliance |
| Ecommerce | High | Recommendations, pricing and customer behaviour |
| Consulting | Medium to high | Cloud migration and client implementations |
| Healthcare | Medium to high | Clinical, operational and compliance data |
| Manufacturing | Medium to high | IoT, production, quality and supply chains |
| IT services | Medium | Enterprise projects and managed services |
| Retail and FMCG | Medium to high | Sales, inventory and consumer analytics |
| Telecommunications | High | Network, customer and streaming data |
The data engineering salary within an industry also depends on the organisation’s technology maturity and the importance of data to its business model.
For example, a traditional manufacturing company beginning its cloud journey may offer different responsibilities and compensation from a digitally mature ecommerce company processing millions of transactions every day.
Data engineers generally earn more than data analysts because engineering roles require deeper programming, infrastructure and system-design capabilities.
| Role | Main Responsibility | Indicative Salary |
| Data analyst | Analyses data and creates reports | ₹4–12 lakh |
| BI developer | Builds dashboards and reporting models | ₹5–15 lakh |
| Data engineer | Builds data pipelines and platforms | ₹6–25 lakh |
| Data scientist | Develops analytical and ML models | ₹7–25 lakh |
| Data architect | Designs enterprise data systems | ₹20–50 lakh or more |
The difference between a data analyst’s compensation and a data engineering salary is not fixed. Senior analysts with strong domain expertise may earn more than junior engineers.
A data analyst can transition into data engineering by developing:
Similarly, backend developers and database professionals can move into data engineering by learning modern data architectures and cloud services.
Data engineering is also a well-paid profession internationally.
In the United States, experienced professionals may earn more than $130,000 annually. Compensation can be significantly higher in product companies when bonuses and equity are included.
In the United Kingdom, salaries may range from approximately £45,000 to £90,000, depending on experience, location and industry.
The data engineering salary in Canada, Australia, Singapore, the Middle East and Europe varies according to market demand, taxation, visa status and the type of organisation.
Professionals comparing international salaries should consider:
A larger salary figure does not automatically result in greater savings or a better quality of life.
Professionals seeking better compensation should follow a deliberate career-development strategy.
Create projects that demonstrate complete data workflows rather than isolated exercises.
A strong portfolio project should include:
Employers value candidates who can explain why they selected a particular architecture and how they handled performance, reliability and security.
Choose Azure, AWS or Google Cloud and become confident with its main data services.
Avoid learning only the names of many tools without being able to implement a working solution. Practical depth is more likely to improve your data engineering salary than superficial exposure to multiple platforms.
Senior roles require an understanding of scalability, reliability, security, performance and cost.
Professionals should be able to explain:
During interviews and performance appraisals, explain measurable outcomes rather than listing routine responsibilities.
Instead of saying:
“I developed ETL pipelines.”
Say:
“I redesigned 15 ETL pipelines, reduced processing time by 40% and lowered monthly cloud costs by 18%.”
Evidence of measurable impact provides stronger justification for a higher data engineering salary.
Senior engineers work with business leaders, analysts, data scientists, security professionals and application-development teams.
The ability to clarify requirements, document decisions and explain technical trade-offs supports promotion into leadership positions.
Changing jobs can produce a larger salary increase than an annual appraisal. However, frequent movement without meaningful skill development may weaken a professional profile.
The best opportunities usually offer a combination of:
Data engineering remains a strong career option because reliable data infrastructure is essential for analytics, automation and artificial intelligence.
AI coding tools may automate some routine SQL generation, documentation and pipeline-development tasks. However, companies still need professionals who can design architecture, validate information, manage security, optimise costs and maintain production reliability.
The data engineering salary is likely to remain attractive for professionals who combine:
Entry-level work may become more automated, making practical experience increasingly important. Candidates who rely only on certificates or memorised interview answers may find it difficult to qualify for high-paying positions.
The average data engineering salary in India is approximately ₹10 lakh per year. Actual salaries vary depending on experience, technical expertise, employer, industry and location.
Freshers can generally expect between ₹4 lakh and ₹8 lakh per year. Candidates with internships, cloud certifications and strong projects may receive higher offers.
Yes. Professionals with approximately four to eight years of relevant experience and expertise in cloud platforms, Spark, Databricks, Snowflake or real-time systems can earn ₹20 lakh or more.
There is no single highest-paying skill. A combination of cloud architecture, Spark, Databricks, data modelling, streaming systems and software-engineering capability generally creates the strongest earning potential.
The average data engineering salary is generally higher than an average data analyst salary because data engineering requires deeper programming and infrastructure knowledge. However, compensation depends on experience, specialisation and business impact.
Yes. Most professional positions require SQL and at least one programming language, commonly Python, Java or Scala. Low-code platforms may support development, but coding ability creates better long-term career flexibility.
Yes. Employers primarily evaluate technical capability, project experience and problem-solving skills. Candidates from non-technical backgrounds may need additional preparation in programming, databases, operating systems and cloud technologies.
Azure, AWS and Google Cloud all offer strong career opportunities. The best option depends on the candidate’s target industries and employers.
AI may automate repetitive development activities, but it is also increasing the need for reliable data platforms. Professionals who use AI tools effectively and develop architecture, governance and engineering skills are likely to remain valuable.
The data engineering salary in India reflects the growing importance of reliable data infrastructure. Freshers may begin with ₹4–8 lakh per year, while experienced engineers, architects and platform leaders can earn ₹25–50 lakh or more.
The strongest salary growth comes from combining advanced SQL, programming, cloud platforms, distributed processing, data modelling and system-design expertise.
Data engineering should not be treated as a collection of tools. It is an engineering discipline focused on creating secure, reliable and scalable systems that make data usable.
Professionals who can solve complex business problems, manage production platforms and support AI-driven applications will continue to command a premium data engineering salary in India and international markets.
Prateek Agrawal Jun 03, 2026 No Comments

There’s a moment every entrepreneur recognises. You’re sitting at your desk at 10 PM, still working through a task that should have taken an hour but has somehow eaten your entire evening. Maybe it’s chasing invoices. Maybe it’s writing product descriptions for 200 SKUs. Maybe it’s following up with leads who haven’t responded in a week. You’re doing the work but you’re not building the business.
This is the gap that AI for entrepreneurs was made to close. And in 2025, AI for entrepreneurs is no longer a future concept. It is a present-day competitive advantage.
Not the AI of science fiction. Not the AI of enterprise IT departments with million-dollar budgets and six-month implementation timelines. The AI that’s available right now, on a laptop, to any business owner willing to invest a few weeks learning how to use it properly.
The numbers back this up. According to SBE Council’s 2026 Small Business Tech Use Survey, 82% of small business employers have already invested in AI tools, and they are rapidly being embedded across daily functions and workflows. The entrepreneurs who are pulling ahead aren’t necessarily the ones with the biggest teams or the deepest pockets. They’re the ones who figured out how to make AI work inside their specific business and started doing it early.
This blog is about exactly that.
Before we talk about what’s possible, let’s talk about what’s common.
Almost every entrepreneur has tried ChatGPT, Claude, or Gemini at some point. They’ve asked it a few questions, maybe drafted an email, and thought okay, that’s useful but not exactly life-changing. And then they went back to doing everything the way they always had.
The problem isn’t the technology. The problem is that most people never go beyond the chat interface.
Using AI only for chat is like buying a Swiss Army knife and only ever using it to open letters. The real power, the part that actually transforms how a business operates comes when you move from prompting to implementing. When you stop asking AI questions and start building consistent, automated processes with it across your marketing, operations, accounts, and sales.
AI business automation uses artificial intelligence to complete tasks and make decisions with little input learning from data patterns and adapting to new situations, making it valuable for businesses seeking to scale without increasing headcount. That last part is especially important for entrepreneurs: scale without headcount. More output, same team.
The entrepreneurs who are seeing real ROI from AI aren’t just using it as a smarter Google. They’re building systems. And that shift from user to builder is where everything changes. That is the true promise of AI for entrepreneurs: not a smarter chatbot, but a smarter business.
Let’s get specific, because vague promises about “AI transforming your business” are not useful to anyone.
Here are real examples of what AI for entrepreneurs looks like in practice:
Monthly Accounts in 15 Minutes. A business owner who used to spend four to five days every month closing accounts and generating P&L statements automated the entire process using an AI financial agent. What once required days of back-and-forth between spreadsheets and accountants now runs in 15 to 30 minutes, with the AI generating income statements, balance sheets, cash flow summaries, and ratio commentary from a trial balance input.
₹2.5 Lakh Saved Per Season on Photography. A kids’ wear brand that previously paid ₹1,000–₹1,200 per product shoot in Mumbai — sending physical products to a studio and waiting days for results — now uses AI-generated product photography. The quality is comparable. The cost is effectively zero. Across two seasons a year, that’s over ₹2.5 lakh in direct savings, not counting the time and logistics saved.
40 Hours of Work Completed in Under 4 Hours A co-founder at a growing company described how a task that used to take an entire work week — research, analysis, compilation — now gets done in a few hours using generative AI. In some cases, the same task now takes 15 to 20 minutes.
Invoice Verification on Autopilot A business receiving daily supplier invoices over email built an AI agent that automatically extracts invoice data at 6:30 PM every evening, cross-references prices against a master Google Sheet, and flags any discrepancies — without any human involvement in the process.
These are not edge cases. These are outcomes that business owners across manufacturing, fashion, retail, exports, and finance have implemented in weeks — often in the first month of learning.

AI for entrepreneurs is not one thing. It’s a set of capabilities that cut across every major business function. Here’s where the impact is largest:
Marketing is the #1 use case for AI among small businesses, with owners reporting improved customer reach, engagement, and revenue generation.
For entrepreneurs, this is where AI delivers the most immediate visible wins. With the right tools and process, a solo founder or small team can produce:
One carpet exporter created a fully AI-generated video invitation for an international trade exhibition in Shanghai — complete with his likeness, voice, product imagery, and event details — using only a photograph as the starting point. The entire video was produced without a production team, studio visit, or significant budget.
This is what modern AI for entrepreneurs looks like in marketing: founder-driven, brand-consistent, and almost entirely automated once the system is set up.
Operations is where most entrepreneurs spend the majority of their time — and where AI delivers the most transformative ROI.
The goal is straightforward: build systems where AI monitors, tracks, and reports on your business so that you spend five minutes reviewing rather than five hours managing.
AI can safely automate up to three hours of business processes per day — freeing time from routine work and letting business owners focus on creative work and innovation.
Practical operational use cases include:
For a fashion entrepreneur needing to track European and Asian market trends, this meant building an agent that delivers a curated weekly briefing every Monday morning — replacing hours of manual research with a five-minute read.
Sales follow-up is one of the highest-value, most neglected functions in small businesses. Leads go cold not because the product isn’t right but because nobody followed up at the right time with the right message.
AI changes this completely. With the right setup:
Sales teams use AI to qualify leads and schedule follow-up calls, while AI automations assist in screening and shortlisting — all with minimal human oversight. For entrepreneurs without dedicated sales teams, this levels the playing field significantly.
One important note on AI calling vs. messaging: the evidence strongly favours WhatsApp and email automation over AI voice calling. Customers respond better to contextual, well-timed messages than to automated calls. The conversion rates are higher, the costs are lower, and the friction is significantly reduced.
Financial reporting is traditionally one of the most time-consuming and error-prone functions in any small business. Month-end closing, P&L generation, variance analysis — these tasks consume days of the accounting team’s time and often delay critical business decisions.
AI agents can now handle the full chain: from ingesting raw trial balance data to generating formatted income statements, balance sheets, cash flow statements, and ratio analysis with plain-language commentary explaining what the numbers mean.
For business owners who want to go further, AI-powered dashboards can replace static PowerBI reports with live, conversational interfaces. Instead of reading charts, you ask the dashboard a question — “What was our gross margin last month compared to the same period last year?” — and get an immediate, accurate answer.
Add a scheduled alert system on top of that, and your financial operations can notify you automatically when key metrics cross thresholds — before problems become crises.
This is the area that surprises most entrepreneurs the most — and where the long-term competitive advantage lies.
Small and medium-sized businesses are now able to enjoy AI capabilities that were, until recently, the preserve of large enterprises, due to the emergence of generative AI.
With the right guidance, entrepreneurs without any coding background are building:
A designer bag exporter built a product visualisation app in under two days that lets customers see how a bag looks in their living room, change handle colours, and swap patterns — all on an iPad at a trade exhibition. His competitor had built something similar. He matched it in 48 hours.

Learning about AI is not the same as implementing it. The entrepreneurs who get real results treat the first 90 days as a structured implementation sprint, not a training programme.
The framework looks like this:
Days 1–30: Quick Wins Identify two or three high-frequency, time-consuming tasks in your business. Build AI solutions for them. The goal is early ROI — something you can point to within the first month that makes the investment feel immediately worthwhile. Most entrepreneurs find their first meaningful win within the first two weeks.
Days 31–60: Build and Automate Take the systems that worked and make them robust. Add AI agents, automate triggers, connect tools. This is where one-off solutions become repeatable processes.
Days 61–90: Scale and Measure Measure the time saved, the cost reduced, and the output increased. Identify the next set of use cases. Build toward a business where AI is running the routine so you can focus on the strategic.
The key principle throughout: implementation over learning. The goal is not to understand AI theoretically. The goal is to have a use case running in your business by the end of week two.

One of the most common misconceptions is that AI for entrepreneurs is only relevant for tech companies or digitally native brands. The evidence says otherwise.
Entrepreneurs who have successfully implemented AI in their businesses in recent cohorts include kids’ wear manufacturers, carpet exporters, home furnishing brands, real estate treasury managers, packaging companies, construction firms, investment advisors, healthcare clinic owners, and senior government officials.
The common thread is not industry or technical background. It is the willingness to invest time in learning the system, identify the right use cases, and commit to implementation with support.
AI has become essential to competitiveness and growth, with small business owners signalling they will continue to invest in tools over the next twelve months. The question is no longer whether to adopt AI. It is how quickly you can build the skills to implement it effectively.
The gap between entrepreneurs who use AI casually and those who build with it is widening every month. The ones who figure it out now will have a structural advantage that compounds over time — in costs saved, hours reclaimed, and competitive capability built.
We’ve designed two programmes specifically for this moment:
The next batch starts soon. Explore the courses →
Q: Do I need a technical background to use AI in my business? Not at all. The majority of AI tools available today are designed for non-technical users. The most important skill is not coding — it is knowing your business well enough to identify where AI can save time or create value. Support teams can handle the technical implementation side.
Q: How quickly can I see results? Most entrepreneurs implementing AI with structured support see their first meaningful result — a working automation, a time-saving tool, a cost reduction — within the first two weeks. Significant operational transformation typically takes 60 to 90 days.
Q: Which business functions should I automate first? Start with whatever is consuming the most time or creating the most bottlenecks right now. For most entrepreneurs, that’s either operations (task management, invoicing, reporting) or marketing (content creation, product photography, social media). Both areas have well-established AI solutions with fast implementation timelines.
Q: Is AI for entrepreneurs only relevant for digital or tech businesses? No. Some of the most compelling results have come from traditional businesses — manufacturing, fashion, exports, construction, and retail. If your business has repetitive processes, data, customer interactions, or content needs, AI can make a meaningful difference.
Q: What’s the difference between using ChatGPT and actually implementing AI in my business? Using ChatGPT for occasional tasks is the equivalent of using a calculator for basic arithmetic. Implementing AI in your business means building systems — agents, automations, and workflows — that run consistently without your involvement. The gap between the two is significant, and crossing it requires structured learning and implementation support.
Q: What’s the best first step for AI for entrepreneurs who are just getting started? The best first step for any AI for entrepreneurs journey is identifying one specific, time-consuming task in your business and solving just that. Don’t try to automate everything at once. Pick one problem, build one solution, and let that early win build your confidence and momentum for what comes next. You don’t need to track every development. You need to build a foundation of understanding that lets you evaluate new tools quickly and a community of peers and experts who can alert you to what actually matters. That combination — practical knowledge plus the right network — is what makes AI adoption sustainable rather than overwhelming.
Prateek Agrawal May 30, 2026 No Comments

If you are a fresh graduate wondering where to begin, enrolling in a data science course for freshers 2026 could be the single most impactful career decision you make this year. India’s data economy is expanding at an extraordinary pace, and employers across Bangalore, Hyderabad, Pune, and Mumbai are actively hunting for entry-level talent who can work with data confidently. The right data science course for freshers 2026 will equip you with Python, machine learning, SQL, and cloud skills that today’s recruiters actually demand. This guide walks you through everything you need to know: what to learn, where to learn it, how much you can earn, and what the job market truly looks like this year.
The Indian data analytics market was valued at over ₹84,000 crore in 2024 and is projected to cross ₹2,00,000 crore by 2028. Behind those numbers are millions of job roles, data analysts, machine learning engineers, business intelligence developers, data engineers, and AI specialists, many of which remain unfilled because the supply of trained professionals simply cannot keep up with demand. This is precisely why a data science course for freshers 2026 has become one of the most searched career-launch decisions among Indian graduates today.
What changed between 2022 and 2026? Three significant things:
Generative AI has become mainstream. Every company, from a Tier-2 SaaS startup to a large public-sector bank, now needs professionals who understand both traditional data pipelines and large language model (LLM) integrations. Any data science course for freshers in 2026 that does not cover generative AI fundamentals is already outdated. Entry-level candidates who know how to work alongside AI tools are considered far more hireable than those who do not.
The cloud-first economy has deepened. AWS, Google Cloud, and Microsoft Azure are now foundational infrastructure for most Indian businesses. A data science course for freshers 2026 should include at least a module on cloud-based data storage, processing, and model deployment to remain industry-relevant.
Tier-2 cities have opened up. Remote and hybrid work has democratised opportunity. Companies are now hiring data professionals from Jaipur, Coimbatore, Nagpur, and Bhopal, not just the traditional tech metros. This means a fresher anywhere in India can access the same quality of roles as someone sitting in Bengaluru, provided their skills are sharp.

A well-structured data science course for freshers 2026 is not the same as it was even three years ago. The curriculum has evolved significantly to reflect new tools, new employer expectations, and new technologies. Here is what a modern, industry-aligned programme should include:
Python remains the dominant language in data science, and for good reason it is versatile, readable, and supported by an enormous ecosystem of libraries. A good data science course for freshers 2026 will start you with Python basics, data types, loops, functions, file handling, before moving into data-specific libraries:
SQL is equally non-negotiable. Almost every real-world data role requires writing queries to extract and transform data from relational databases. Look for a data science course for freshers 2026 that spends at least 20–30 dedicated hours on SQL, covering joins, subqueries, window functions, and query optimisation.
One of the biggest mistakes freshers make is skipping the mathematical foundations in favour of jumping straight to model-building. Statistics forms the backbone of every machine learning technique, and the best data science course for freshers 2026 will make sure you understand it deeply. A solid programme covers:
You do not need to be a mathematician, but you do need enough statistical intuition to interpret results correctly and avoid common modelling pitfalls.
This is the core of most programmes. A complete data science course for freshers 2026 should cover both supervised and unsupervised learning:
In 2026, a competitive data science course for freshers will also introduce deep learning fundamentals — neural networks, CNNs, and RNNs — along with an introduction to transformer architectures, which underpin most modern AI systems.
Raw data is almost always messy. A significant portion of a practising data scientist’s time goes into cleaning, transforming, and understanding data before any model is built. The best data science course for freshers 2026 simulates this reality with messy, real-world datasets rather than polished toy examples, so you are prepared for what actual work looks like.
Being able to build a model is only half the job. Communicating findings to non-technical stakeholders such as product managers, business heads, CFOs is equally important. A strong data science course for freshers 2026 will include tools like:
Modern data science does not end at a Jupyter notebook. Freshers are now expected to understand how models get deployed and maintained in production. A forward-looking data science course for freshers 2026 should introduce:
This is the newest — and most exciting — addition to entry-level curricula. Understanding how to use APIs like OpenAI or Claude, build simple RAG (Retrieval Augmented Generation) pipelines, and work with vector databases is fast becoming a standard expectation. Any data science course for freshers 2026 worth your money will include at least an introductory module on generative AI tools and workflows.

With hundreds of options available, from 12-week bootcamps to two-year postgraduate programmes — choosing the right data science course for freshers 2026 is critical. Here are the factors that should guide your decision:
Check when the syllabus was last updated. A data science course for freshers designed in 2021 will not cover generative AI, modern MLOps tools, or the latest industry frameworks. Ask the provider directly or look for syllabi published on their website. If the course still treats deep learning as “advanced optional content,” move on.
Recruiters in India’s data science market care far more about your portfolio than your certificates. A strong data science course for freshers 2026 should include at least 3–5 end-to-end projects on real datasets — ideally across different domains such as finance, healthcare, e-commerce, and logistics.
Look for programmes that offer live sessions with industry practitioners, code reviews, and dedicated placement assistance. Mock interviews, resume workshops, and access to hiring networks significantly increase your chances of landing your first role after completing a data science course for freshers 2026.
For freshers with no prior background, a programme of 6–12 months is typically necessary to build genuine proficiency. Shorter crash courses may introduce concepts but rarely produce job-ready candidates. When evaluating a data science course for freshers 2026, ask providers for placement statistics — specifically median time-to-hire and average starting salary — before enrolling.
Reputable programmes in India range from ₹30,000 for self-paced online courses to ₹3,00,000 or more for full-time immersive bootcamps with placement guarantees. Many platforms offering a data science course for freshers 2026 also provide EMI options, income-share agreements, or merit-based scholarships.

Understanding the landscape before you enter it saves time and helps you target the right roles.
Bengaluru leads as India’s data science hub, but Hyderabad, Pune, Chennai, and the NCR (Noida and Gurugram) are all strong markets. In 2026, remote-first roles are especially common in product companies and global capability centres (GCCs), giving freshers outside metros genuine opportunities without relocating — provided they have completed a solid data science course for freshers 2026 that prepared them for independent work.
A certificate alone will not get you an interview. What matters is proof that you can apply your skills to real problems. The best data science course for freshers 2026 will help you build this portfolio as part of the programme, but here is how to go further:
Every project should be uploaded to GitHub with a clear README explaining the business problem, methodology, key findings, and model performance metrics. Kaggle competitions are an excellent way to benchmark your skills — even a top-50% finish on a public competition demonstrates that you can work with messy, real data under defined objectives.
Writing about what you learn — a tutorial, a case study, a model explainer — signals communication skills and genuine intellectual curiosity. A consistent LinkedIn presence showing your projects, learnings, and industry engagement can open unexpected doors, especially when you are fresh out of a data science course for freshers 2026 and building your professional network.
Picking a course based on price alone. The cheapest data science course for freshers 2026 is rarely the best value. Look at placement outcomes, mentor quality, and curriculum depth before making a decision.
Overloading on theory without practising coding. Data science is applied. Every concept you study should be followed by hands-on implementation in Python or SQL. If your data science course for freshers 2026 is lecture-heavy with minimal coding exercises, find a better one.
Ignoring communication skills. The best models in the world create zero value if you cannot explain your findings to a non-technical audience. Practice presenting your project results as if you were speaking to a business leader.
Skipping statistics. Many learners rush to neural networks before mastering linear regression. This creates fragile understanding. Build your statistical foundations before advancing — the right data science course for freshers 2026 will enforce this sequence.
Not networking. Attend data science meetups (DataHack Summit, NASSCOM events, local Kaggle meetups), join Discord and Slack communities, and reach out to data professionals on LinkedIn. Many jobs in India are still filled through referrals.
While a structured programme is essential, supplementing your data science course for freshers 2026 with quality free resources accelerates growth significantly:
The field is not static. As you build your initial skills through a data science course for freshers 2026, stay aware of where the profession is heading:
The fundamentals you build through a quality data science course for freshers 2026 — strong Python skills, statistical thinking, data intuition, and clear communication — will remain valuable regardless of which tools and platforms rise and fall over the next decade.
The demand for data professionals in India has never been higher, and the barriers to entry have never been lower. If you are a fresher in 2026 looking to break into this field, completing the right data science course for freshers 2026 gives you access to better opportunities, higher starting salaries, and a faster growth trajectory than almost any other technical path available today.
Be deliberate. Choose a data science course for freshers 2026 that is current, hands-on, and career-focused. Build real projects. Network consistently. And remember that every senior data scientist you admire today started exactly where you are now — staring at their first Python error message and deciding to figure it out.
Your data science career starts today. The industry is waiting.
Prateek Agrawal May 27, 2026 No Comments
Every technological leap in history has arrived wearing the same ominous costume: the threat of mass unemployment. When the steam engine roared to life in the 18th century, textile workers smashed looms in protest. When the automobile rolled off the first assembly line, horse breeders and carriage makers trembled. When ATMs multiplied across city streets in the 1970s and 80s, economists predicted the end of bank tellers. In every single case, the doomsday scenario never fully materialized. Instead, something far more interesting happened — the economy grew, new industries were born, and the workforce evolved.
We are standing at that crossroads again. Artificial intelligence is the technology of the moment, and the fear is back: AI is going to take your job. Headlines scream about layoffs attributed to automation. Viral posts list roles on the chopping block. And yes, some of those fears are legitimate — AI is, and will continue to, displace certain types of work.
But the complete picture is far more optimistic. Beneath the noise of layoff announcements lies a powerful, data-backed story about AI and job creation — one of the most significant economic forces of our time. The conversation around AI and job creation has been drowned out by fear, but the data tells a very different story. AI is not a job killer. It is a growth engine, and the numbers prove it.
Let’s be honest about what’s driving the anxiety. The 2026 corporate landscape has been unsettling. Dozens of Fortune 500 companies announced significant workforce reductions, with many citing AI-driven restructuring as a contributing factor. The headlines are real. The disruption is real.
But context matters enormously. Every major general-purpose technology — electricity, the internet, computers — followed an identical arc. Short-term displacement of specific roles. Medium-term confusion and retraining. Long-term explosion of entirely new industries and net job gains that far exceeded what was lost.
John Maynard Keynes, writing in the 1930s, called technological unemployment “only a temporary phase of maladjustment.” He wasn’t dismissing workers’ pain — he was identifying a pattern. The maladjustment is real. The permanence is not.
AI is following this pattern with startling precision.
Here’s where the conversation shifts from fear to facts.
The World Economic Forum’s Future of Jobs Report projects that 170 million new jobs will be created globally by 2030, while approximately 92 million existing roles are displaced — resulting in a net gain of 78 million positions. That is not a catastrophe. That is the largest net job creation event in modern economic history.
Annual AI-specific job creation tells an equally compelling story. Approximately 5 million new AI-related positions emerged in 2025 alone. That number is projected to climb to 6 million in 2026, 7 million in 2027, and reach 13 million new jobs per year by 2030. The global AI job market is already valued at approximately $1.84 trillion — and that figure captures both direct AI roles and the vast ecosystem of indirect employment they support across industries.
In the United States, AI-related job postings climbed 25.2% year-over-year in Q1 2025, reaching over 35,000 active postings. Globally, AI-related job creation now spans 164 countries, with emerging economies — often left behind in previous technological revolutions — accounting for roughly one-third of those gains. When we talk about AI and job creation, this global reach is one of the most underreported parts of the story.
This is not marginal growth. This is a structural economic shift.

Skeptics often ask a fair question: what are these new AI jobs, exactly? It’s one thing to cite aggregate numbers, and another to show the actual roles materializing in the real economy. AI and job creation skeptics want specifics — and the specifics are compelling.
The answer is both more concrete and more exciting than most people expect.
AI Engineers have seen role growth of 143.2% year-over-year. Prompt Engineers — professionals who specialize in crafting inputs that get the best outputs from AI systems — grew 135.8%. AI Content Creators, who blend machine-generated drafts with human editorial judgment, grew 134.5%. These are not edge-case technical roles; they are entering mainstream hiring across industries from marketing to healthcare to finance.
Then there are the roles created to govern and safeguard AI itself. AI trainers, ethicists, and explainability experts are emerging fields created directly by AI adoption. As organizations grapple with bias, transparency, and accountability in automated systems, entirely new professional disciplines are being born. AI safety specialists are projected to grow at a 15% annual rate — a field that, for all practical purposes, didn’t exist fifteen years ago.
Job postings mentioning “agentic AI” — systems capable of autonomous, multi-step task completion — grew 985% between 2023 and 2024. The infrastructure powering all of this AI is also generating massive employment: data center jobs are projected to reach 650,000 by 2026, with an estimated 340,000 positions currently unfilled. The Stargate Project alone, the massive U.S. AI infrastructure initiative, promises over 100,000 new American jobs.
What all these roles share is a common trait: they are fundamentally human jobs empowered by AI, not human jobs replaced by it.
One of the clearest signals that AI is creating economic value — not just shifting it — is what’s happening to wages.
Workers with AI skills currently earn a 56% wage premium over peers in identical roles without those skills. PwC’s 2025 analysis confirmed this finding and noted that the premium had jumped dramatically from 25% just one year earlier. Professionals holding multiple AI competencies see that premium extend further still.
This wage acceleration matters for the broader “AI kills jobs” debate. In a zero-sum scenario — where AI simply replaces workers without creating new value — you would not expect wages to rise. You would expect cost-cutting, commoditization, and wage depression. Instead, the opposite is happening. Employers are paying significantly more for human talent that can work with AI, a clear signal that the human-AI combination is generating more economic output than either could alone.
This is the augmentation story in wage form. AI is not replacing the worker. It is making the worker more valuable.

The job creation impact of AI is uneven across sectors — which is precisely what we should expect from a general-purpose technology in its early adoption phase. But sector by sector, AI and job creation are becoming inseparable stories.
Healthcare is the standout story. In 2025, it was the single largest creator of AI-related jobs, generating more than 640,000 new positions linked to automated diagnostics, predictive analytics, and virtual patient support. AI is not replacing doctors and nurses — it is creating new roles for clinical AI specialists, medical data analysts, and patient experience coordinators who work alongside AI systems to improve outcomes.
Manufacturing is undergoing a similar transformation. Advanced robotics and AI-powered quality control are displacing certain assembly-line tasks — but they’re simultaneously creating demand for robotics technicians, automation engineers, and supply chain AI specialists who manage the new systems. Employment in manufacturing automation-adjacent roles is growing faster than overall manufacturing employment is declining.
Financial services are using AI to handle compliance monitoring, fraud detection, and routine customer queries — freeing human advisors to focus on complex, relationship-driven financial planning. The net effect: fewer entry-level data processing roles, more mid-tier analytical and advisory positions.
The creative industries tell perhaps the most counterintuitive story. Rather than being hollowed out by generative AI, they are expanding. The demand for human creative direction, brand strategy, and ethical content oversight has increased as the volume of AI-generated content has grown. Someone needs to train the models, curate the outputs, and make the judgment calls that algorithms can’t.
When mechanized looms arrived in England’s textile mills, the Luddites did not simply misunderstand economics — they accurately perceived that their specific skills were being devalued. Their pain was real. Their prediction, however, was wrong.
The industrial revolution ultimately created far more employment than it destroyed. It created entirely new categories of work that no one could have predicted beforehand — factory managers, railroad engineers, telegraph operators, urban planners. More importantly, it raised living standards across the board by dramatically increasing economic productivity.
AI is operating on the same logic at an even greater scale. The displacement is real and concentrated in specific roles, particularly those involving repetitive, routine cognitive tasks. But the creation is broad, accelerating, and reaching corners of the global economy that previous technological revolutions never touched.
The McKinsey Global Institute estimates AI could generate between 20 and 50 million new jobs worldwide by 2030. The Asia-Pacific region alone added approximately 1.1 million new AI-related positions in 2025, accounting for roughly 47% of global AI job growth that year. India led developing markets with more than 490,000 new AI jobs. This is not a story of wealthy nations hoarding technological gains. When it comes to AI and job creation, it is a genuinely global growth engine.
If AI is a net positive for employment — and the data strongly suggests it is — then why does the fear persist so powerfully? Because the transition is genuinely hard, and it is not equally distributed. Understanding AI and job creation means understanding both sides: the new opportunities being born and the real transitions workers must navigate to reach them.
The workers most at risk are those in roles where AI can automate routine, repetitive cognitive tasks: data entry, basic customer service, standard report generation, routine legal discovery. These are often mid-skill, middle-income roles, and the workers who hold them may not have obvious off-ramps to AI-augmented positions without significant retraining.
This is the real policy challenge of the AI era. Not “will there be enough jobs” — the numbers say yes. But “will the people whose jobs are displaced be able to access the new ones?” That question requires investment: in education systems, in retraining programs, in portable benefits that support workers during transitions.
Mentions of AI in U.S. job listings surged 56.1% in 2025, building on explosive growth in 2023 and 2024. AI fluency is no longer optional across industries — it is rapidly becoming a baseline qualification the way computer literacy did in the 1990s. The workers and institutions that treat this transition as urgent will be the ones positioned to capture its gains.
That’s exactly the gap our Gen AI Course was built to close. Whether you’re a professional looking to stay relevant, a team lead preparing your department for AI integration, or a developer ready to go deeper — it gives you the practical skills to work with AI, not be replaced by it. And if you’re building a business around this shift, our AI for Entrepreneurs Course walks you through how to identify opportunities, deploy AI tools strategically, and turn this industrial moment into a competitive edge.

Perhaps the most telling indicator of where this is all heading is what employers themselves are saying about AI and their workforce plans.
86% of employers expect AI to transform their organization by 2030 — but the majority of those employers also plan to grow their headcount, not shrink it. They’re not buying AI to eliminate people. They’re buying AI to make their people capable of doing more. The companies seeing the strongest AI-driven productivity gains are those that deployed AI alongside their workforce, investing in training and integration rather than headcount reduction.
The Autodesk AI Jobs Report framed it clearly: human skills aren’t being replaced — they’re being revalued. Technical fluency is merging with creativity, communication, and judgment in ways that AI cannot replicate. The most valuable professionals of the next decade will not be those who can compete with AI, but those who can direct it.
The story of AI and job creation is not a story without pain. Real workers are experiencing real disruption, and the transition costs are not equally shared. That deserves acknowledgment, policy attention, and genuine investment in workforce development.
But the macro story — the one told by 170 million projected new jobs, a 56% wage premium for AI-skilled workers, 640,000 new healthcare roles, and AI-related job growth spanning 164 countries — is unambiguously a story of expansion, not elimination.
Every great industrial transformation looked like a threat before it revealed itself as an opportunity. The steam engine, the electric grid, the internet — each one arrived with legitimate fears attached, and each one ultimately generated more prosperity than it destroyed.
AI is the next chapter in that story. It is not the end of work. It is the beginning of a new kind of work — more creative, more strategic, better paid, and more broadly distributed across the global economy than any technological shift that came before it.
The growth engine is running. The question is whether we’re ready to get in.
The transition to an AI-powered economy is not waiting for anyone. The professionals and entrepreneurs who move now — building skills, understanding tools, and positioning themselves on the right side of this shift — will have a significant advantage over those who wait.
We’ve built two courses specifically for this moment:
The industrial revolution rewarded those who adapted early. So will this one. Explore our courses →
Q: What does the research say about AI and job creation overall? The research is clear: AI and job creation go hand in hand at the macro level. The World Economic Forum, McKinsey, and PwC all point to net positive employment outcomes, a 56% wage premium for AI-skilled workers, and new role categories growing at triple-digit rates year-over-year. The challenge is transition, not elimination.
Q: Is AI really creating more jobs than it’s destroying? Yes — according to the World Economic Forum’s Future of Jobs Report, AI is projected to create 170 million new jobs globally by 2030 while displacing 92 million, resulting in a net gain of 78 million positions. The displacement is real, but the net effect is strongly positive.
Q: What kinds of jobs is AI creating? A wide range — from highly technical roles like AI Engineers (up 143% year-over-year) and Prompt Engineers (up 136%) to creative, ethical, and operational roles like AI content creators, AI trainers, data ethicists, and AI safety specialists. Healthcare, manufacturing, financial services, and the creative industries are all seeing significant AI-driven job growth.
Q: Which jobs are most at risk from AI? Roles involving routine, repetitive cognitive tasks are most vulnerable — data entry, basic customer service, standard report generation, and routine administrative work. However, even many of these roles are being transformed rather than eliminated, shifting toward AI oversight and quality control functions.
Q: Do I need to be technical to benefit from AI in my career? Not at all. While technical roles like AI engineering are growing fast, the majority of high-growth AI-adjacent roles require a blend of domain expertise, communication, creativity, and AI fluency — not deep coding skills. Our Gen AI Course is designed specifically for non-technical professionals who want to work effectively alongside AI.
Q: How can entrepreneurs take advantage of the AI boom? The opportunity for entrepreneurs is significant — AI lowers the cost of building, automates operational bottlenecks, and opens entirely new product categories. The key is knowing which tools to use, where to deploy them, and how to build AI into your business model strategically rather than reactively. That’s what our AI for Entrepreneurs Course covers in depth.
Q: How quickly is the AI job market growing? Very quickly. AI-related job postings in the U.S. grew 25.2% year-over-year in Q1 2025. Globally, AI employment spans 164 countries, with the Asia-Pacific region adding over 1.1 million new AI-related roles in 2025 alone. Annual AI-specific job creation is projected to reach 13 million new positions per year by 2030.
Q: Is it too late to build AI skills? No — in fact, we’re still in the early adoption phase. AI fluency is becoming a baseline qualification across industries, similar to how computer literacy became essential in the 1990s. Workers who invest in AI skills now will command a significant wage premium — currently averaging 56% above peers without those skills — and be positioned for the best opportunities as the market matures.
Prateek Agrawal May 13, 2026 No Comments
Artificial Intelligence has changed the way people work, learn, research, create content, analyze data, and make decisions. Tools like ChatGPT, Gemini, Claude, and Microsoft Copilot have made AI accessible to almost everyone. Today, a student can use AI to understand a topic, a marketer can use AI to write campaigns, a developer can use AI to generate code, and a business leader can use AI to analyze reports.
But as people started using AI more seriously, one major challenge became clear.
AI can sometimes give answers that sound confident but are not completely accurate.
This becomes a serious issue when AI is used for business, legal, finance, healthcare, education, or internal company processes. A generic answer is not enough. The AI system must be able to answer from the right source, using the right information, and preferably with reference to trusted documents.
This is where RAG in AI becomes important.
RAG stands for Retrieval-Augmented Generation. It is one of the most useful approaches in modern artificial intelligence because it helps AI systems generate answers based on relevant and trusted information. Instead of depending only on what the model already knows, RAG allows the AI to first search for the right information and then generate an answer using that information.
In simple words, RAG in AI helps make AI more accurate, updated, and useful for real-world applications.
RAG in AI means Retrieval-Augmented Generation. The term has two important parts: retrieval and generation.
Retrieval means finding relevant information from a source. This source can be a PDF, website, database, knowledge base, company policy document, research paper, Excel file, product manual, or any other document.
Generation means creating a human-like answer using a Large Language Model, also called an LLM.
When these two steps are combined, the AI first retrieves the most relevant information and then generates an answer based on it. This makes the response more grounded and context-specific.
For example, suppose a company has an HR policy document. An employee asks:
“Can I carry forward my unused leaves to next year?”
A normal chatbot may give a general answer based on common HR practices. But a RAG-based system will first search the company’s actual HR policy document, find the section related to leave carry-forward, and then answer based on that exact document.
This is the main value of RAG in AI. It allows AI to answer using your own knowledge, not just general internet-level knowledge.
Large Language Models are trained on massive amounts of text. They learn language, patterns, concepts, facts, and reasoning styles from this training. That is why they can answer many types of questions.
But they have limitations.
First, they may not know the latest information. If something happened after the model’s training period, the model may not have that knowledge.
Second, they do not automatically know private company data. For example, an AI model does not know your company’s latest sales policy, HR handbook, project report, legal contract, pricing sheet, training manual, or customer support process unless you provide it.
Third, LLMs can hallucinate. This means they may generate information that sounds correct but is actually wrong or unsupported.
Fourth, in business use cases, users often need source-based answers. They want to know where the answer came from. A generic response is not enough.
Because of these limitations, businesses needed a method to connect AI models with trusted knowledge sources. That method is RAG.
The goal of RAG in AI is not just to make AI sound smarter. The goal is to make AI more reliable, contextual, and useful for practical work.
A RAG system may sound technical, but the basic process is easy to understand.
The first step is to collect the knowledge sources. These may include company documents, PDFs, SOPs, manuals, FAQs, website pages, policy files, contracts, reports, or training content.
For example, a customer support team may collect product manuals, troubleshooting guides, return policies, and common customer questions.
Large documents are difficult to search and process at once. So they are divided into smaller sections called chunks.
For example, a 100-page document may be divided into smaller paragraphs or sections. Each chunk contains a specific piece of information.
This step is important because the system needs to find the exact section that is relevant to the user’s question.
The next step is to convert the text into embeddings. An embedding is a numerical representation of meaning.
This helps the AI system understand similarity between ideas, even if the exact words are different.
For example, the question “What is the notice period?” and a document section that says “Employees must serve 60 days before resignation” may not use the same words, but they are related in meaning. Embeddings help the system find that connection.
The embeddings are stored in a vector database. A vector database allows the system to search by meaning rather than only by exact keywords.
This is different from traditional search. A normal keyword search looks for matching words. A vector search looks for matching meaning.
When the user asks a question, the system also converts the question into an embedding.
Then it compares the question with all stored document chunks and finds the most relevant pieces of information.
The system retrieves the best matching chunks from the knowledge base.
For example, if the user asks about refund rules, the system retrieves the refund policy section.
Finally, the retrieved information is given to the language model along with the user’s question. The model uses this information to generate a clear and natural answer.
This full process is what makes RAG in AI so powerful.

Let us imagine a training institute that has hundreds of pages of course content, placement policies, project guidelines, FAQs, and student support documents.
Students often ask questions like:
“What is the project submission process?”
“How many doubt-clearing sessions are available?”
“What is the placement eligibility rule?”
“Which tools are covered in the course?”
“How do I prepare my portfolio?”
Without RAG, the institute may need support staff to answer these questions manually. Students may also waste time searching through long documents.
With a RAG-based AI assistant, all these documents can be added to a knowledge base. When a student asks a question, the AI assistant retrieves the relevant document section and gives a direct answer.
This saves time for the support team and gives students faster responses.
This is why RAG in AI is becoming so important for education, training, customer service, and enterprise knowledge management.
RAG matters because it helps AI move from generic answers to trusted answers.
Most businesses do not just want an AI that can write good English. They want an AI that can understand their documents, follow their policies, refer to their data, and support their workflows.
RAG makes this possible.
One of the biggest concerns with AI is hallucination. A chatbot may produce an answer that sounds polished but is not based on facts.
RAG reduces this problem by giving the AI relevant source material before it answers. The model is not forced to guess. It can use retrieved information from trusted documents.
This does not mean RAG makes AI perfect. But it improves reliability significantly.
A public AI model does not automatically know your company’s internal documents. But with RAG, an organization can connect AI to its own knowledge base.
This is useful for HR policies, finance reports, legal contracts, product manuals, sales playbooks, compliance documents, customer support FAQs, and internal training content.
For enterprises, RAG in AI is one of the most practical ways to make AI useful with company-specific information.
LLMs are trained at a particular point in time. They may not know the latest policy changes, product updates, market prices, or compliance rules.
RAG solves this by allowing the knowledge base to be updated separately. You do not need to retrain the entire model every time something changes.
For example, if your company updates its refund policy, you can update the document in the knowledge base. The AI assistant can then retrieve the latest version.
In many RAG systems, the AI can show the source of the answer. This is very useful when users need to verify information.
For example, a legal AI assistant can show which case or clause was used. An HR bot can show the exact policy section. A research assistant can show which document supports the answer.
This improves transparency and builds user confidence.
In most organizations, knowledge is scattered across folders, PDFs, emails, spreadsheets, websites, and internal portals. Employees spend a lot of time searching for information.
A RAG-based assistant allows users to ask questions in natural language and get direct answers.
For example:
“Summarize this contract.”
“Find the penalty clause.”
“What does our travel policy say about hotel reimbursement?”
“What were the key points from the last sales report?”
“Which SOP explains the machine maintenance process?”
This can save hours of manual search time.

RAG can be used across many industries and departments.
In customer support, it can answer questions from product manuals, FAQs, warranty policies, and troubleshooting documents.
In HR, it can help employees understand leave rules, reimbursement policies, onboarding processes, benefits, payroll rules, and appraisal guidelines.
In legal teams, it can help search contracts, clauses, case laws, legal judgments, and compliance documents.
In finance, it can help retrieve information from audit reports, loan documents, invoices, annual reports, and regulatory filings.
In education, it can power AI tutors that answer questions from course notes, recorded session transcripts, assignments, and reading material.
In manufacturing, it can support SOP search, machine manual lookup, quality control guidance, maintenance documentation, and safety instructions.
In sales and marketing, it can help teams find product details, competitor comparisons, pitch decks, pricing documents, case studies, and customer success stories.
The most powerful use of RAG in AI is in situations where people need accurate answers from large volumes of documents.
A normal chatbot answers from its trained knowledge. A RAG-based chatbot answers using retrieved information from a connected knowledge source.
This difference is very important.
If you ask a normal chatbot, “What is the refund policy?”, it may explain what refund policies usually include. But if you ask a RAG-based chatbot connected to your company documents, it can answer based on your actual refund policy.
A normal chatbot is useful for general knowledge. A RAG-based chatbot is useful for specific knowledge.
That is why companies are increasingly moving from simple chatbots to RAG-powered assistants.

RAG is powerful, but it is not perfect.
The quality of the answer depends on the quality of the source documents. If the documents are outdated, incomplete, or wrong, the AI may produce weak answers.
Retrieval quality also matters. If the system retrieves the wrong chunk, the final answer may not be accurate.
Document formatting is another challenge. Scanned PDFs, poorly structured documents, messy tables, and unclear headings can reduce the performance of a RAG system.
RAG also needs regular maintenance. Old documents should be removed. New documents should be added. Access permissions should be managed carefully. Sensitive information should be protected.
For complex questions, basic RAG may not be enough. Advanced systems may need reranking, metadata filtering, multi-step retrieval, knowledge graphs, or agent-based workflows.
Still, for many real-world use cases, RAG in AI remains one of the most practical and effective approaches.
Businesses should care about RAG because it turns static knowledge into usable intelligence.
Every company has valuable knowledge hidden in documents, reports, manuals, contracts, emails, and presentations. The problem is that this knowledge is often difficult to find at the right time.
RAG changes that.
It allows employees to interact with company knowledge through simple questions. Instead of opening folders and reading long documents, they can ask the AI assistant and get a direct response.
This improves productivity, reduces dependency on specific people, speeds up decision-making, and creates a more knowledge-driven organization.
For companies planning AI adoption, RAG in AI is often a better starting point than building complex AI agents immediately. It is practical, understandable, and directly connected to business problems.
The future of RAG will be more advanced and more integrated.
Today, many RAG systems work mainly with text documents. In the future, RAG systems will work more smoothly with images, audio, video, charts, dashboards, spreadsheets, emails, and business applications.
AI agents will also use RAG to retrieve information before taking action. For example, an AI agent may read a policy, summarize it, draft an email, update a CRM, create a report, and notify a manager.
This means RAG will not remain only a question-answering technology. It will become a foundation for intelligent workflows.
As AI becomes more common in business, professionals who understand RAG will have a major advantage.
RAG is one of the most important concepts in modern artificial intelligence. It helps AI systems become more accurate, reliable, contextual, and business-ready.
A normal AI model answers from general training. A RAG-based system answers from relevant documents and trusted sources.
That difference matters.
For students, RAG is an important concept to learn because it is used in many AI projects and job roles. For professionals, it helps explain how AI can work with company data. For businesses, it provides a practical way to build AI assistants, knowledge bots, support tools, and document intelligence systems.
In simple terms, RAG in AI helps artificial intelligence move from generic answers to source-based answers.