
Prateek Agrawal Nov 17, 2026 No Comments
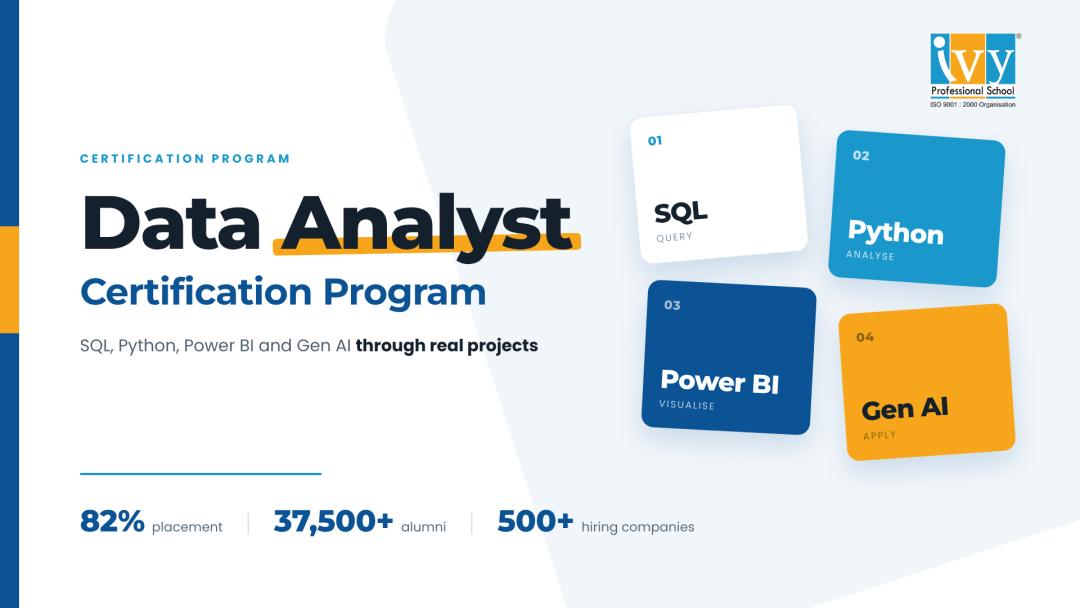
A data analyst certification program is often the fastest structured route into a data career. It gives you a clear syllabus, real tools and proof of skill that employers can check.
This guide explains what a good program teaches, how the learning path works, which tools matter, and what to expect on salary and placement. It is written for freshers, working professionals changing careers and aspiring data analysts.
Quick answer: The best data analyst certification program teaches SQL, Python, Power BI and Gen AI through real projects. It then helps you with your resume, mock interviews and hiring company introductions.
A data analyst certification program is a structured course that trains you in the skills a data analyst uses at work. It ends with an assessment, projects and a certificate.
The certificate alone does not get you hired. The skills, the projects and the placement support behind it do.
A certificate shows you attended a course. A certification shows you passed an assessment that tests real skill.
Employers value the second. Pick a data analyst certification program that tests you on queries, dashboards and case problems, not on memorised definitions.
Every team now works with data. Sales, finance, HR, marketing and operations all need a data analyst who can answer business questions with numbers.
A certification program gives you a faster and more focused path than studying alone. You follow a tested sequence, get feedback and build a portfolio.
Most job descriptions ask for the same core skills:
A good program covers all six and proves them through projects.
Three groups benefit most. Each starts from a different place.
If you have just finished a degree in commerce, science, engineering or arts, this program gives you a job-ready skill set. You do not need a coding background.
Many learners come from sales, operations, finance or teaching. Your domain knowledge is a real advantage. A finance executive who learns SQL and Power BI can move into a finance analytics role faster than most freshers.
If you already know some Excel or have tried free tutorials, a certification program fills the gaps. You get a fixed sequence, trainer feedback and projects you can show in interviews.
Use this table to compare programs before you pay any fee.
| Component | What it should cover | Why it matters |
| Excel and statistics | Formulas, pivot tables, probability | Builds analytical thinking |
| SQL | Joins, subqueries, window functions | Tested in most interviews |
| Python | pandas, NumPy, Matplotlib | Handles large, messy data |
| Power BI | Power Query, DAX, dashboards | Turns analysis into reports |
| Gen AI | Prompting, LLM tools, tokenization | Speeds up routine work |
| Capstone projects | End-to-end business problems | Gives proof of skill |
| Placement support | Resume, mock interviews, hiring partners | Turns skill into offers |
Sequence matters more than the number of topics. This path suits most learners.
Begin with Excel, basic statistics and how business data is structured. Learn to summarise numbers with averages, medians and distributions.
Do not skip this stage. Weak statistics is the main reason a new data analyst presents a confident chart with the wrong answer.
Most business data sits in databases, so SQL comes next. Learn to filter, group, join and rank data until you can answer a business question unaided.
Python lets you handle data that is too large or too messy for Excel. Learn it after SQL, once you already think in tables and filters.
Now learn to present your findings. Power BI turns your analysis into dashboards that managers read in minutes.
The final stage adds Gen AI skills, a capstone project and placement preparation. By now you can build something real and explain it clearly.

Tools change, but the thinking behind them lasts. Here is what you should be able to do with each one.
SQL is how you ask a database questions. Almost every data analyst interview has a SQL round.
Focus on these areas:
Practise on realistic tables such as orders, customers and products. Interviewers prefer clean queries over memorised syntax.
Python is the main programming language for analysis and automation. You use it to clean data, explore patterns and repeat work without manual effort.
Core libraries to learn:
A typical task is taking a large sales file, fixing dates, removing duplicates and finding the products that drive profit.
Power BI is widely used in Indian companies for dashboards that refresh automatically. A strong report answers one business question at a glance.
Key skills include:
If your manager needs a long explanation of your dashboard, redesign it.
Gen AI tools can draft SQL and Python, summarise reports and sort customer feedback into themes. They save time, but they also make mistakes.
Check every output against the data. A data analyst who verifies Gen AI output is faster. One who trusts it blindly is a risk.
Tokenization splits text into small units called tokens. A token can be a word, part of a word or a single character.
This matters to a data analyst for three reasons:
Knowing this helps you design better Gen AI workflows and avoid surprise costs.

Most learners need several months of regular study to become job-ready. The exact time depends on your starting point and the hours you can give each week.
Plan the learning path in stages and finish one project before starting another. Rushing through topics leaves gaps that interviews expose.
Be careful with promises of results in a few weeks. Real skill takes repeated practice on real data.
Tools get you shortlisted. Judgement gets you hired. Employers look for a few habits that no software teaches.
Know how the company makes money. A number matters only when you can link it to revenue, cost or customer experience.
Explain findings in plain words. Use one chart per point and one sentence per finding.
Ask why a number looks odd before you report it. A careful check catches errors that embarrass analysts later.
A capstone project separates a certificate from a skill. Recruiters want to see how you handle a full problem, from raw data to a recommendation.
| Project | Business question | Tools | What you deliver |
| Sales and profit dashboard | Which regions and products earn most? | SQL, Power BI | Interactive dashboard |
| Customer churn analysis | Why are customers leaving? | Python | Findings and a simple model |
| HR attrition study | Who is likely to resign? | Python, Power BI | Report with recommendations |
| Feedback analyser | What do customers complain about? | Python, Gen AI, tokenization | Summary of themes |
Put each project in a portfolio with a short write-up. State the problem, the data, your method and the result in plain language.
Add a link to your dashboard or code. A hiring manager should grasp your work in two minutes.
Pay depends on your city, skills, domain and the company. No data analyst certification program can promise a fixed salary, and you should be wary of any that does.
These factors usually raise the offer:
| Profile | What raises pay | Salary range per year (INR) |
| Fresher data analyst | SQL, Power BI, strong projects | ₹3.5 to 6 lakh |
| Career switcher | Domain knowledge plus data skills | No sourced range |
| Experienced data analyst | Python, Gen AI, business impact | ₹8 to 15 lakh |
Ivy Professional School reports a 67% average salary hike for learners who move into new roles after training. Your own result depends on your starting point and effort.
Placement support should be specific, not a vague promise. Ask every institute exactly what it does for you.
A useful data analyst certification program with placement includes:

Honest answers tell you more than any brochure.
Your first role is a starting point, not a ceiling. Most learners begin in one of a few common roles.
After two or three years, many analysts move into senior analyst, analytics manager or data science roles. Choose a domain early. An analyst who understands retail, banking or healthcare is harder to replace.
Imagine a retail manager asks why sales fell last month. A good analyst clarifies the question before opening a chart.
Follow this sequence:
The result is a one-page summary. The manager wants to know what happened and what to do next.
Your resume should show what you built, not only what you studied. Lead with projects, name the tools and state the result in one line.
Expect technical, case-based and behavioural rounds. Technical rounds test your queries and logic. Case rounds give you a business problem and ask how you would approach it.
Practise explaining a project aloud. If you cannot describe your dashboard in two minutes, the interviewer will notice.
Ivy Professional School has trained learners in data skills since 2008. These are the approved figures for our programmes.
| Measure | Figure |
| Experience | 18+ years (since 2008) |
| Alumni | 37,500+ |
| Trainers | 400+ |
| Hiring companies | 500+ |
| Placement | 82% |
| Average salary hike | 67% |
| Google rating | 4.8/5 from 2,250+ reviews |
| Recognition | Recognized by MeitY |
Classes run in Kolkata, Bangalore, Delhi, Pune and Mumbai, with an online option for learners elsewhere. The program focuses on SQL, Python, Power BI and Gen AI, with projects at every stage.
Many learners lose months to avoidable errors. Watch for these:
Depth beats breadth. Employers hire people who can finish a task.
Working professionals have less time but more context. A steady routine beats occasional long sessions.
Treat your job as a source of project ideas. A report you build for your team can become a portfolio piece.
Use this short checklist before you pay:
If most answers are yes, you are looking at a serious program.
Learning data skills takes steady effort over several months. Some people receive an offer quickly, and others need more projects and more interview practice.
That is normal. Keep building, keep applying and ask for feedback after every interview. Each round teaches you something the next round will reward.
Track progress in a simple sheet. Note each application, the interview stage reached and the topics you found hard. After ten interviews, the pattern shows you exactly what to revise.
No. A good program starts from the basics. Many successful analysts began with only Excel.
Learn SQL first. It is easier to start with and appears in almost every interview.
No program can guarantee a job. A good one improves your skills, portfolio and access to hiring companies, and your effort decides the rest.
Data analytics rewards steady practice. Choose a data analyst certification program that teaches SQL, Python, Power BI and Gen AI through real projects, and supports you all the way to the interview.
Start with one small project this week, share it with a mentor and improve it based on feedback. Small, consistent steps compound faster than learners expect.
If you are ready to start, speak to an Ivy counsellor and as

Prateek Agrawal Nov 07, 2026 No Comments
Choosing a data analytics course with placement is one of the most practical career decisions you can make today. Every company, from a neighbourhood retailer to a large bank, now depends on people who can turn raw numbers into clear decisions.
This guide explains what a good data analytics course should teach, how the learning path works, which tools matter, and what to expect on salary and placement. It is written for freshers, working professionals changing careers, and aspiring data analysts.
Quick answer: A strong data analytics course with placement teaches SQL, Python, Power BI and Gen AI through real projects. It then supports you with resume work, mock interviews and introductions to hiring companies.
Data skills are now a basic expectation in sales, finance, HR, marketing and operations. Employers want a data analyst who can query a database, clean messy files and explain the result to a manager.
A course alone does not get you hired. A data analytics course with placement links your learning to hiring, so the skills you build match what companies actually test.
Most job descriptions for a data analyst ask for the same core skills:
If your data analytics course covers these and proves them through projects, you are building the right profile.

This path suits three groups. Each starts from a different point.
If you have just finished a degree in commerce, science, engineering or arts, a data analytics course gives you a job-ready skill set. You do not need a coding background. A good programme starts from the basics and builds up.
Many learners come from sales, operations, finance, HR or teaching. Your domain knowledge is an advantage. A marketing executive who learns SQL and Power BI can often move into a marketing analytics role faster than a fresh graduate.
If you already know some Excel or have tried a few online tutorials, structured training fills the gaps. You get a defined sequence, feedback from trainers and projects you can show in interviews.
Not every data analytics course is built the same way. Use this table to check what you are being offered.
| Component | What it should cover | Why it matters |
| Excel and statistics | Formulas, pivot tables, probability | Builds analytical thinking |
| SQL | Joins, subqueries, window functions | Tested in most analyst interviews |
| Python | pandas, NumPy, Matplotlib | Handles large, messy data |
| Power BI | Power Query, DAX, dashboards | Turns analysis into reports |
| Gen AI | Prompting, LLM tools, tokenization | Speeds up routine analysis |
| Capstone projects | End-to-end business problems | Gives you proof of skill |
| Placement support | Resume, mock interviews, hiring partners | Converts skills into offers |
A clear sequence matters more than the number of topics. This learning path works for most beginners.
Start with Excel, basic statistics and the way business data is structured. Learn how to spot errors in a dataset and how to summarise numbers using averages, medians and distributions.
Do not skip this stage. Weak statistics is the most common reason a new data analyst presents a confident chart with a wrong answer.
Move to SQL next, because most business data sits in databases. Learn to filter, group, join and rank data until you can answer a business question without help.
Python comes third, once you think in tables and filters. It lets you handle data that is too large or too messy for Excel.
Now learn to present. Power BI turns your SQL and Python output into dashboards that managers can read in minutes.
The last stage adds Gen AI skills, capstone projects and placement preparation. By now you have enough skill to build something real and explain it clearly.
Tools change, but the thinking behind them stays useful. Here is what you should be able to do with each one.
Python is the main programming language for a modern data analyst. You use it to clean data, run analysis and automate repeat work.
Core libraries to learn:
A typical task is taking a large sales file, removing duplicates, fixing dates and finding which products drive the most profit. If you can do that end to end, you are ready for most entry-level Python questions.
SQL is how you ask a database questions. Almost every data analytics interview includes a SQL round, so this skill carries real weight.
Focus on these areas:
Practise on real tables like orders, customers and products. Interviewers prefer a candidate who writes clean queries over one who memorises syntax.
Power BI is the most common reporting tool in Indian companies. A data analyst uses it to build dashboards that update automatically.
Key skills include:
A good dashboard answers one business question quickly. If your manager needs a long explanation, redesign it.

Gen AI tools now help with writing first-draft SQL and Python, summarising reports and classifying customer feedback. They save time, but they make mistakes.
Learn to check every output against the data. A data analyst who uses Gen AI carefully is faster. One who trusts it blindly is a risk.
Tokenization means splitting text into small units called tokens. A token can be a word, part of a word or a single character.
Language models read and produce tokens, not full sentences. This matters to you for three reasons:
Understanding this helps you build better Gen AI workflows and avoid surprise costs.
Imagine a retail manager asks why sales fell last month. A good analyst does not open a chart first. They start by clarifying the question.
Follow this sequence:
The result is a one-page summary, not a long report. The manager wants to know what happened and what to do next.
Tools get you shortlisted. Judgement gets you hired. Employers look for a few habits that no software teaches.
Know how the company makes money. A number only matters when you can link it to revenue, cost or customer experience.
Explain findings in plain words. Use one chart per point and one sentence per finding.
Ask why a number looks odd before you report it. A careful check catches errors that embarrass analysts later.
Capstone projects separate a certificate from a skill. Recruiters want to see how you handle a full problem, from raw data to a recommendation.
| Project | Business question | Tools | What you deliver |
| Sales and profit dashboard | Which regions and products earn the most? | SQL, Power BI | Interactive dashboard |
| Customer churn analysis | Why are customers leaving? | Python | Findings and a prediction model |
| HR attrition study | Which employees are likely to resign? | Python, Power BI | Report with recommendations |
| Customer feedback analyser | What do customers complain about? | Python, Gen AI, tokenization | Summary of themes |
Put every project in a portfolio with a short write-up. State the problem, the data, your method and the result in plain language.
Add a link to your dashboard or code. A hiring manager should understand your work in two minutes.
Pay depends on your city, your skills, your domain and the company. A data analytics course with placement cannot promise a fixed salary, and you should be careful of any institute that does.
Here is what usually moves the number up:
| Profile | What raises pay | Salary range per year (INR) |
| Fresher data analyst | SQL, Power BI, strong projects | [Insert approved range] |
| Career switcher | Domain knowledge plus data skills | [Insert approved range] |
| Experienced data analyst | Python, Gen AI, business impact | [Insert approved range] |
Ivy Professional School reports a 67% average salary hike for learners who move into new roles after training. Your own result will depend on your starting point and effort.
Your first role is a starting point, not a ceiling. Most learners begin in one of a few common roles and grow from there.
After two or three years, analysts often move into senior analyst, analytics manager or data science roles. The path you pick depends on whether you enjoy people, business strategy or deeper technical work.
Pick a domain early. An analyst who understands retail, banking or healthcare is harder to replace than a generalist.
Placement support should be specific, not a vague promise. Ask any institute exactly what it does for you.
A useful data analytics course with placement includes:
Honest answers to these questions tell you more than any brochure.
Your resume should show what you built, not only what you studied. Lead with projects, name the tools you used and state the result in one line.
Expect three kinds of questions: technical, case-based and behavioural. Technical rounds test your queries and your logic. Case rounds hand you a business problem and ask how you would approach it.
Practise explaining a project aloud. If you cannot describe your own dashboard in two minutes, an interviewer will notice.
Ivy Professional School has trained learners in data skills since 2008. The numbers below are the approved figures for our programmes.
| Measure | Figure |
| Experience | 18+ years (since 2008) |
| Alumni | 37,500+ |
| Trainers | 400+ |
| Hiring companies | 500+ |
| Placement | 82% |
| Average salary hike | 67% |
| Google rating | 4.8/5 from 2,250+ reviews |
| Recognition | Recognized by MeitY |
Classes run across Kolkata, Bangalore, Delhi, Pune and Mumbai, with an online option for learners elsewhere. The data analytics course focuses on SQL, Python, Power BI and Gen AI, with projects at every stage.
Many learners lose months on avoidable errors. Watch for these:
Depth beats breadth. Employers hire people who can finish a task, not people who have seen every tool.
Working professionals have less time but more context. A steady routine works better than occasional long sessions.
Treat your current job as a source of project ideas. A report you build for your own team can become a portfolio piece.
Use this short checklist before you pay any fee:
If the answer to most of these is yes, you are looking at a serious data analytics course with placement.
Learning data skills takes steady effort over several months. Some people get an offer quickly, and others need more projects and more interview practice.
That is normal. Keep building, keep applying and ask for feedback after every interview. Each round teaches you something that the next round will reward.
Track your progress in a simple sheet. Note each application, the interview stage reached and the topics you found hard. After ten interviews, the pattern will show you exactly what to revise.
No. A good programme starts from the basics. Many successful data analysts began with only Excel.
Learn SQL first. It is easier to start with, and it appears in almost every interview.
No course can guarantee a job. A good one improves your skills, your portfolio and your access to hiring companies, and the effort you put in decides the rest.
Data analytics rewards people who practise consistently, week after week, with real datasets. Pick a course that teaches SQL, Python, Power BI and Gen AI through real projects, and supports you all the way to the interview table.
If you are ready to start, speak to an Ivy counsellor and ask for the full syllabus, project list and placement details.
Prateek Agrawal Aug 22, 2026 No Comments
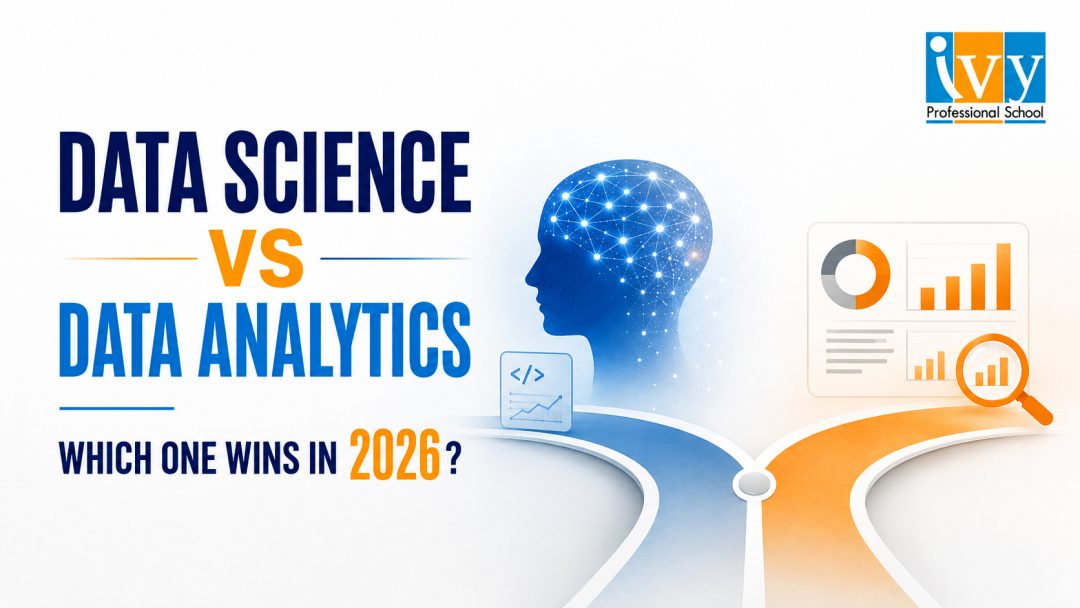
If you’re weighing your next career move, chances are you’ve typed some version of “data science vs data analytics 2026” into a search bar more than once. It’s one of the most common questions among students, working professionals, and career switchers trying to break into the data industry — and for good reason. Both fields are booming, both pay well, and both are often confused with one another. But they are not the same career path, and picking the wrong one for your goals, skills, and personality can cost you months of misdirected effort.
This guide breaks down the real differences between the two fields — the skills, tools, salaries, career trajectories, and day-to-day realities of each role — so you can make a confident, informed decision about which one suits you in the year ahead.
Data analytics is the practice of examining existing data to answer specific business questions. A data analyst looks backward and sideways — what happened, why did it happen, and what does it mean for the business right now? Analysts work heavily with dashboards, spreadsheets, SQL queries, and visualization tools like Power BI and Tableau to turn raw numbers into decisions marketing, sales, and operations teams can act on.
Typical data analyst responsibilities include:
Data analytics is often the more accessible entry point into the data world. The learning curve is gentler, the tools are more business-friendly, and the career transition — especially for commerce, business, or non-engineering graduates — tends to be faster. Many analysts also enjoy a shorter feedback loop: a dashboard built on Monday can influence a marketing decision by Friday, which makes the day-to-day work feel immediately tied to business outcomes rather than abstract experimentation.
Data science goes a step further. Instead of just interpreting what already happened, data scientists build predictive models that estimate what’s likely to happen next. This involves statistics, machine learning, and programming, along with a strong intuition for business context. A data scientist might build a model that predicts customer churn, forecasts demand, or powers a recommendation engine.
Typical data scientist responsibilities include:
Where analytics is about interpreting the past, data science is about predicting and shaping the future. That extra layer of complexity is exactly why so many learners struggle to tell the two roles apart — on the surface they look similar, but underneath they demand very different skill sets, tools, and ways of thinking about problems.

Let’s lay out the head-to-head comparison that defines this landscape heading into the new year.
| Aspect | Data Analytics | Data Science |
| Core focus | Descriptive & diagnostic (“what happened”) | Predictive & prescriptive (“what will happen”) |
| Key tools | SQL, Excel, Power BI, Tableau | Python, R, TensorFlow, Scikit-learn |
| Math depth | Basic statistics | Advanced statistics, probability, linear algebra |
| Coding requirement | Light to moderate | Heavy, production-grade code |
| Typical output | Dashboards, reports | ML models, predictive systems |
| Entry difficulty | Easier for beginners | Steeper learning curve |
| Career ceiling | Analytics Manager, BI Lead | Data Science Lead, ML Engineer, AI Architect |
This table is the fastest way to visualize the decision, but numbers on a page don’t tell you which path actually fits your temperament, background, or long-term ambitions. Let’s go deeper.
To succeed as a data analyst in 2026, you’ll want to build proficiency in:
To succeed as a data scientist in 2026, the bar is higher and more technical:
This is where the data science vs data analytics 2026 gap becomes most obvious: analytics rewards business fluency and tool proficiency, while data science demands genuine engineering and mathematical depth.

Compensation is one of the biggest deciding factors for most career switchers, and it’s a major part of any honest comparison between these two fields. Numbers shift year to year as demand fluctuates, but the general gap between the two roles has held steady for the past several hiring cycles, and 2026 is no exception.
Data Analyst salaries (India, 2026 estimates):
Data Scientist salaries (India, 2026 estimates):
Data science roles generally command a salary premium because of the technical depth and business impact of predictive modeling. That said, experienced analysts who specialize — particularly in domains like fintech, healthcare, or supply chain — can close much of that gap, and senior analysts with strong SQL, dashboarding, and stakeholder-management skills are rarely short of opportunities. Salary isn’t the only factor to weigh here, but it’s a meaningful one, especially for career switchers trying to calculate the return on investment of several months of upskilling before they commit their time and money.
A common misconception among students comparing these two careers is that one path is strictly “better” than the other. In reality, they lead to different destinations, and the “better” choice is entirely a function of what kind of work you actually enjoy doing every day:
Data Analytics career path: Data Analyst → Senior Analyst → Analytics Manager → BI Lead / Head of Analytics. Many analysts also pivot laterally into product management, growth, or operations roles, since the business-facing skills translate well.
Data Science career path: Data Scientist → Senior Data Scientist → ML Engineer / AI Specialist → Data Science Lead → Chief Data Officer. Data scientists with strong engineering chops can also transition into MLOps, AI product development, or research-oriented roles.
Notably, in 2026, the boundary between the two paths is getting blurrier. Many analytics roles now expect basic Python and even light machine learning knowledge, while many data science teams rely on analysts to handle the exploratory groundwork before a model gets built. Understanding this convergence is essential to making a smart decision about which career to pursue — the “pure” versions of either role are becoming rarer, and hybrid skill sets are increasingly the norm across hiring listings, job descriptions, and internal role definitions at both startups and large enterprises.

The industries hiring for these roles overlap heavily, but the specific job titles and day-to-day expectations shift depending on the sector.
Industries that lean heavily on data analysts:
Industries that lean heavily on data scientists:
Almost every industry now employs both roles side by side, often on the same team. A retail company, for instance, might have analysts monitoring daily sales dashboards while data scientists build the demand-forecasting model those dashboards eventually feed into. Rather than competing career tracks, the two roles frequently function as two halves of the same data pipeline — which is worth keeping in mind if you’re choosing based purely on “which field is more in demand,” since the honest answer is: both are, in nearly every sector.
There’s no universal right answer to this question — the right path depends on your background, strengths, and goals. Here’s a practical way to decide.
Choose Data Analytics if you:
Choose Data Science if you:
If you’re still unsure, a good rule of thumb: start with data analytics fundamentals — SQL, Excel, visualization — since these skills are foundational to both paths anyway. Once you have that base, you can decide whether to specialize further into analytics or level up into data science with Python, statistics, and machine learning.
No comparison of these two careers would be complete without addressing generative AI’s impact on both roles. GenAI tools are now assisting analysts with writing SQL queries, generating dashboard summaries, and automating repetitive reporting tasks — effectively raising the productivity bar for entry-level analysts. On the data science side, GenAI is changing how models get built entirely, with teams increasingly fine-tuning large language models, building retrieval-augmented generation (RAG) systems, and integrating AI agents into existing data pipelines.
This means that regardless of which side of the divide you choose, a working understanding of generative AI is quickly becoming a baseline expectation rather than a nice-to-have. Professionals who ignore this shift risk falling behind peers who actively upskill in GenAI alongside their core analytics or data science training.
Making the right call in this career debate is only half the battle — the other half is getting trained by people who actually understand where the industry is heading. Ivy Pro School is an 18-year-old institute with IIT Guwahati E&ICT Academy certification, partnerships with NASSCOM and IBM, and a track record of 37,500+ alumni placed through 500+ hiring partners. With a Pay After Placement model, you don’t pay full fees until you’re actually employed — which keeps the incentive structure aligned with your success, not just enrollment numbers.
Whether you’re leaning toward analytics or data science, Ivy Pro School offers two standout ways to start exploring hands-on, right now:
🎓 FREE Live Gen AI Session — Experience two full classes before you commit. If the GenAI angle of this comparison caught your attention, this is the easiest way to see what building with generative AI actually feels like, with zero upfront cost for the trial classes.
🎓 AI for Entrepreneurs Course with Prateek Agrawal — Built for professionals who want to apply AI and data skills directly to business growth, rather than purely technical roles. If your interest in data science or analytics is really about making smarter business decisions, this course bridges that gap directly.
Both programs are backed by Ivy Pro School’s Pay After Placement model, and a proven placement network — so you’re not just learning in a vacuum, you’re building toward an actual outcome.
Is data science better than data analytics in 2026?
Neither is objectively “better” — data science typically offers a higher salary ceiling and more technical depth, while data analytics offers a faster entry point and strong business-facing career growth. The right choice depends on your skills and goals.
Can I switch from data analytics to data science later?
Yes. Many professionals start as data analysts, build strong SQL and business analysis foundations, and later transition into data science by learning Python, statistics, and machine learning. This is one of the most common — and practical — paths in the industry.
Do I need a coding background for data analytics?
Not necessarily. Data analytics is more accessible to non-technical professionals, since much of the work involves SQL, Excel, and visualization tools rather than heavy programming.
Is data science harder to learn than data analytics?
Generally, yes. Data science requires a stronger foundation in statistics, programming, and machine learning, making the learning curve steeper compared to data analytics.
Which pays more, data science or data analytics, in 2026?
On average, data science roles pay more due to their technical complexity and direct impact on predictive business outcomes. However, experienced, specialized analysts can still command competitive salaries.
How long does it take to become job-ready in either field?
With focused training, most learners can become job-ready in data analytics within 4–6 months, while data science typically requires 6–12 months given its steeper technical requirements.
Do I need a degree in computer science or statistics to enter either field?
No. Both fields are increasingly skills-based rather than degree-based. Bootcamps, certification programs, and portfolio projects are widely accepted by employers as proof of capability, particularly for analytics roles and entry-level data science positions.
The data science vs data analytics 2026 decision ultimately comes down to how you want to work with data — interpreting the past and guiding present-day decisions, or building systems that predict and shape the future. Both careers are in high demand, both are being reshaped by generative AI, and both offer real, well-paying career paths for people willing to put in the work. Start with your strengths, be honest about how much technical depth you’re willing to build, and choose the path that keeps you motivated to keep learning — because in this industry, the learning never really stops.
Prateek Agrawal May 30, 2026 No Comments

If you are a fresh graduate wondering where to begin, enrolling in a data science course for freshers 2026 could be the single most impactful career decision you make this year. India’s data economy is expanding at an extraordinary pace, and employers across Bangalore, Hyderabad, Pune, and Mumbai are actively hunting for entry-level talent who can work with data confidently. The right data science course for freshers 2026 will equip you with Python, machine learning, SQL, and cloud skills that today’s recruiters actually demand. This guide walks you through everything you need to know: what to learn, where to learn it, how much you can earn, and what the job market truly looks like this year.
The Indian data analytics market was valued at over ₹84,000 crore in 2024 and is projected to cross ₹2,00,000 crore by 2028. Behind those numbers are millions of job roles, data analysts, machine learning engineers, business intelligence developers, data engineers, and AI specialists, many of which remain unfilled because the supply of trained professionals simply cannot keep up with demand. This is precisely why a data science course for freshers 2026 has become one of the most searched career-launch decisions among Indian graduates today.
What changed between 2022 and 2026? Three significant things:
Generative AI has become mainstream. Every company, from a Tier-2 SaaS startup to a large public-sector bank, now needs professionals who understand both traditional data pipelines and large language model (LLM) integrations. Any data science course for freshers in 2026 that does not cover generative AI fundamentals is already outdated. Entry-level candidates who know how to work alongside AI tools are considered far more hireable than those who do not.
The cloud-first economy has deepened. AWS, Google Cloud, and Microsoft Azure are now foundational infrastructure for most Indian businesses. A data science course for freshers 2026 should include at least a module on cloud-based data storage, processing, and model deployment to remain industry-relevant.
Tier-2 cities have opened up. Remote and hybrid work has democratised opportunity. Companies are now hiring data professionals from Jaipur, Coimbatore, Nagpur, and Bhopal, not just the traditional tech metros. This means a fresher anywhere in India can access the same quality of roles as someone sitting in Bengaluru, provided their skills are sharp.

A well-structured data science course for freshers 2026 is not the same as it was even three years ago. The curriculum has evolved significantly to reflect new tools, new employer expectations, and new technologies. Here is what a modern, industry-aligned programme should include:
Python remains the dominant language in data science, and for good reason it is versatile, readable, and supported by an enormous ecosystem of libraries. A good data science course for freshers 2026 will start you with Python basics, data types, loops, functions, file handling, before moving into data-specific libraries:
SQL is equally non-negotiable. Almost every real-world data role requires writing queries to extract and transform data from relational databases. Look for a data science course for freshers 2026 that spends at least 20–30 dedicated hours on SQL, covering joins, subqueries, window functions, and query optimisation.
One of the biggest mistakes freshers make is skipping the mathematical foundations in favour of jumping straight to model-building. Statistics forms the backbone of every machine learning technique, and the best data science course for freshers 2026 will make sure you understand it deeply. A solid programme covers:
You do not need to be a mathematician, but you do need enough statistical intuition to interpret results correctly and avoid common modelling pitfalls.
This is the core of most programmes. A complete data science course for freshers 2026 should cover both supervised and unsupervised learning:
In 2026, a competitive data science course for freshers will also introduce deep learning fundamentals — neural networks, CNNs, and RNNs — along with an introduction to transformer architectures, which underpin most modern AI systems.
Raw data is almost always messy. A significant portion of a practising data scientist’s time goes into cleaning, transforming, and understanding data before any model is built. The best data science course for freshers 2026 simulates this reality with messy, real-world datasets rather than polished toy examples, so you are prepared for what actual work looks like.
Being able to build a model is only half the job. Communicating findings to non-technical stakeholders such as product managers, business heads, CFOs is equally important. A strong data science course for freshers 2026 will include tools like:
Modern data science does not end at a Jupyter notebook. Freshers are now expected to understand how models get deployed and maintained in production. A forward-looking data science course for freshers 2026 should introduce:
This is the newest — and most exciting — addition to entry-level curricula. Understanding how to use APIs like OpenAI or Claude, build simple RAG (Retrieval Augmented Generation) pipelines, and work with vector databases is fast becoming a standard expectation. Any data science course for freshers 2026 worth your money will include at least an introductory module on generative AI tools and workflows.

With hundreds of options available, from 12-week bootcamps to two-year postgraduate programmes — choosing the right data science course for freshers 2026 is critical. Here are the factors that should guide your decision:
Check when the syllabus was last updated. A data science course for freshers designed in 2021 will not cover generative AI, modern MLOps tools, or the latest industry frameworks. Ask the provider directly or look for syllabi published on their website. If the course still treats deep learning as “advanced optional content,” move on.
Recruiters in India’s data science market care far more about your portfolio than your certificates. A strong data science course for freshers 2026 should include at least 3–5 end-to-end projects on real datasets — ideally across different domains such as finance, healthcare, e-commerce, and logistics.
Look for programmes that offer live sessions with industry practitioners, code reviews, and dedicated placement assistance. Mock interviews, resume workshops, and access to hiring networks significantly increase your chances of landing your first role after completing a data science course for freshers 2026.
For freshers with no prior background, a programme of 6–12 months is typically necessary to build genuine proficiency. Shorter crash courses may introduce concepts but rarely produce job-ready candidates. When evaluating a data science course for freshers 2026, ask providers for placement statistics — specifically median time-to-hire and average starting salary — before enrolling.
Reputable programmes in India range from ₹30,000 for self-paced online courses to ₹3,00,000 or more for full-time immersive bootcamps with placement guarantees. Many platforms offering a data science course for freshers 2026 also provide EMI options, income-share agreements, or merit-based scholarships.

Understanding the landscape before you enter it saves time and helps you target the right roles.
Bengaluru leads as India’s data science hub, but Hyderabad, Pune, Chennai, and the NCR (Noida and Gurugram) are all strong markets. In 2026, remote-first roles are especially common in product companies and global capability centres (GCCs), giving freshers outside metros genuine opportunities without relocating — provided they have completed a solid data science course for freshers 2026 that prepared them for independent work.
A certificate alone will not get you an interview. What matters is proof that you can apply your skills to real problems. The best data science course for freshers 2026 will help you build this portfolio as part of the programme, but here is how to go further:
Every project should be uploaded to GitHub with a clear README explaining the business problem, methodology, key findings, and model performance metrics. Kaggle competitions are an excellent way to benchmark your skills — even a top-50% finish on a public competition demonstrates that you can work with messy, real data under defined objectives.
Writing about what you learn — a tutorial, a case study, a model explainer — signals communication skills and genuine intellectual curiosity. A consistent LinkedIn presence showing your projects, learnings, and industry engagement can open unexpected doors, especially when you are fresh out of a data science course for freshers 2026 and building your professional network.
Picking a course based on price alone. The cheapest data science course for freshers 2026 is rarely the best value. Look at placement outcomes, mentor quality, and curriculum depth before making a decision.
Overloading on theory without practising coding. Data science is applied. Every concept you study should be followed by hands-on implementation in Python or SQL. If your data science course for freshers 2026 is lecture-heavy with minimal coding exercises, find a better one.
Ignoring communication skills. The best models in the world create zero value if you cannot explain your findings to a non-technical audience. Practice presenting your project results as if you were speaking to a business leader.
Skipping statistics. Many learners rush to neural networks before mastering linear regression. This creates fragile understanding. Build your statistical foundations before advancing — the right data science course for freshers 2026 will enforce this sequence.
Not networking. Attend data science meetups (DataHack Summit, NASSCOM events, local Kaggle meetups), join Discord and Slack communities, and reach out to data professionals on LinkedIn. Many jobs in India are still filled through referrals.
While a structured programme is essential, supplementing your data science course for freshers 2026 with quality free resources accelerates growth significantly:
The field is not static. As you build your initial skills through a data science course for freshers 2026, stay aware of where the profession is heading:
The fundamentals you build through a quality data science course for freshers 2026 — strong Python skills, statistical thinking, data intuition, and clear communication — will remain valuable regardless of which tools and platforms rise and fall over the next decade.
The demand for data professionals in India has never been higher, and the barriers to entry have never been lower. If you are a fresher in 2026 looking to break into this field, completing the right data science course for freshers 2026 gives you access to better opportunities, higher starting salaries, and a faster growth trajectory than almost any other technical path available today.
Be deliberate. Choose a data science course for freshers 2026 that is current, hands-on, and career-focused. Build real projects. Network consistently. And remember that every senior data scientist you admire today started exactly where you are now — staring at their first Python error message and deciding to figure it out.
Your data science career starts today. The industry is waiting.
Prateek Agrawal May 02, 2026 No Comments
Prateek Agrawal Apr 28, 2026 No Comments

Prateek Agrawal Apr 25, 2026 No Comments
Team Jan 05, 2023 No Comments
Ivy Jan 16, 2020 No Comments

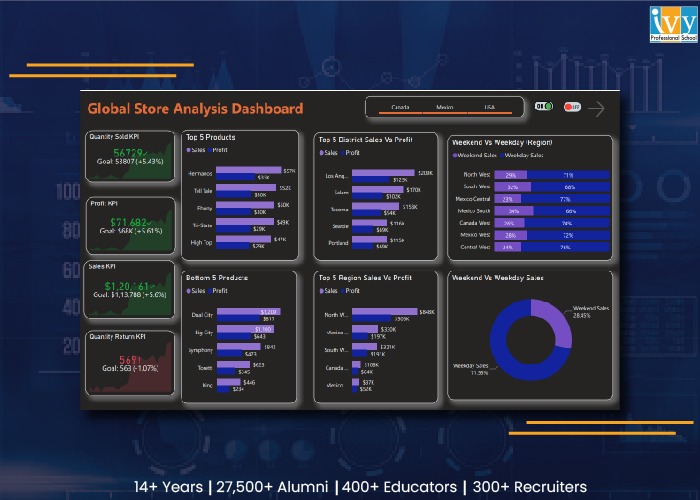
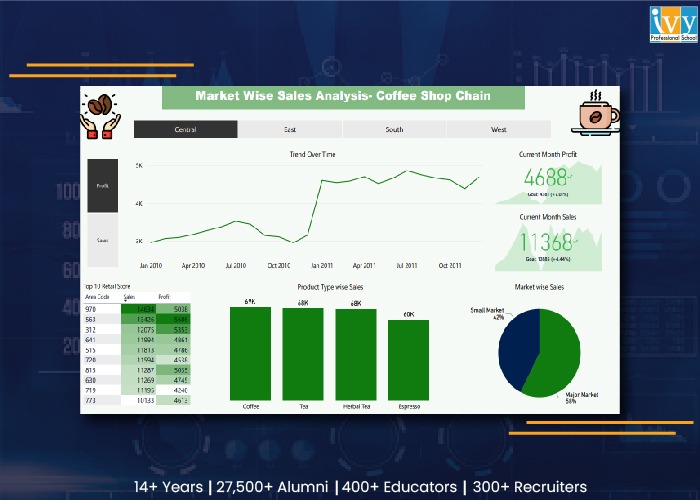
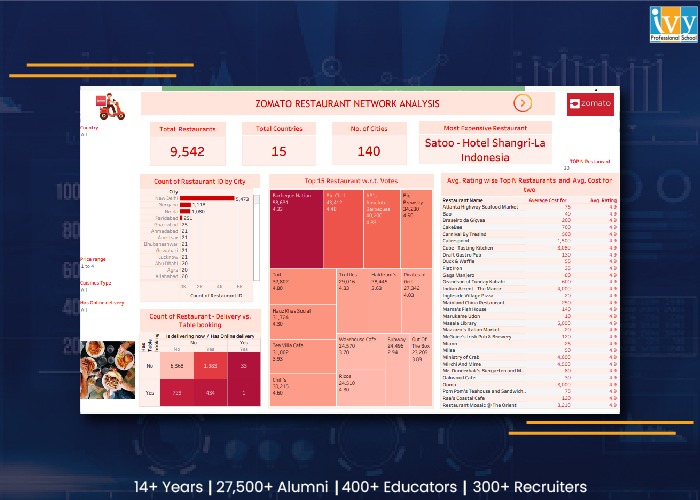
Data Visualization has gained massive popularity lately. Not only is th