Team Nov 02, 2022 No Comments
Data engineering is among the most in-demand career options presently and a highly profitable one at that. And if you are thinking about what data engineering holds, what will be the growth pathway, or how to become a data engineer, then you are at the right place. In this article, we are going to have a look at some of the most effective data engineering tips that you can imbibe for a better data engineering career option.
Data engineers basically create reservoirs for storing data and also take care of these reservoirs. They are generally guardians of the data which is available to companies. They manage all our personal data and also preserve it. They help in making sufficient unorganized data into data that can be used so that business analysts and also data scientists can anticipate it.
A data engineer basically arranges datasets as per the requirement of the industry. They test, construct, and maintain the primary database mechanism. They are also responsible for creating algorithms for converting data into useful structures and formulating the latest data analytics tools. Data engineers collaborate with management teams to know the aim of the company.
As stated above, data engineering is an interdisciplinary profession that needs a mixture of technical and also business knowledge to create the most impact. Beginning a career in data engineering, it is not always clear what is important to be successful. So these data engineering tips will help you in navigating your career better.
There are five primary tips that we would recommend to any data engineer who is just starting their career.
Skill is the key. It opens avenues to many new chances. Skills are required for every job role and one needs to learn the skill sets that are needed so that one can have a roadmap of what that specific job entails. The below-mentioned skills are needed to be a successful data engineer.
Coding is an important skill you need to work with data on a bigger scale. Python is one of the most used languages to master data science. Along with Python, you can also master Java, Scala, and many more. These are crucial for analysis.
As a data engineer, you will basically be needing to function with databases, constructing, handling, and extracting data from databases. These are basically two types of databases (DBMS) that you will work with:
Moving data from several sources of data to a single database is a part of the ETL process. By using these technologies, data can be converted into valuable data.
The ETL process involves transferring data from various sources of data to a single database. These technologies allow data to be transformed into useful data.
It’s excellent to know how to save data, but you should also be familiar with online data storage. Data is stored online using cloud computing to boost accessibility.
It helps to have a foundational understanding of machine learning. Although it is not directly related to data engineers, machine learning aids them in understanding the requirements of a data scientist.
Data engineers, like those in every other profession, must frequently communicate with a variety of people, including business analysts, data scientists, and other data engineers.
Your skills can be validated with a certificate. It gives the potential employer a sense of your abilities and experience. You can choose from a number of reputable platforms for accredited courses. You can choose professional courses and one best in the industry is from Ivy Professional School.
A certificate can be used to verify your abilities. It provides the prospective employer with information about your skills and experience. For authorized courses, you have a variety of trustworthy sites to pick from. Create a solid portfolio, do industry-level projects, and get into case studies that will help you to a great extent.
Once you get a job, you will know that data engineering is a growing career. You should keep in mind nevertheless that learning doesn’t end here. Working with data requires ongoing learning and development. Languages are constantly evolving, so it’s important to stay up with these changes if you want to advance as a data engineer. Join or start a group that focuses on data engineering and associated skills so that everyone in the community can contribute their thoughts and continue to hone their abilities.
Using your Linkedin profile, you can get in touch with various businesses or work for yourself. Share your resume with them, ask them to provide you with some work, and show your want to work for the organization and team. Your college career and confidence will grow if you work on beginner-level assignments. Extrovert yourself. Make friends with others. Every day, acquire new knowledge. You will benefit from having an internship in your early career.
Working on tasks at the introductory level will advance your academic career and confidence. Be outgoing yourself. Make new acquaintances. Learn something new every day. You will benefit from having an internship in your early career. Such a large amount of data requires laborious management. Industries can manage their data effectively thanks to data engineers. It is simple for you to find employment in this industry if you have the necessary talents and follow all the above-mentioned data engineering tips, such as coding, data storage, cloud storage, etc. Obtaining a legitimate certificate will elevate your profile.
Team Jul 20, 2022 No Comments
Data analytics is all about collecting and analyzing raw data to find valuable patterns and insights that answer questions or solve problems. This helps businesses make smart decisions, improve efficiency, increase customer satisfaction, and drive more revenue.
If you want to master data analytics, you must know the different types of data analytics employed in industries. So, in this post, we will discuss the four main data analytics types in detail with examples. You will understand what they are, how they differ from each other, and why they are important.
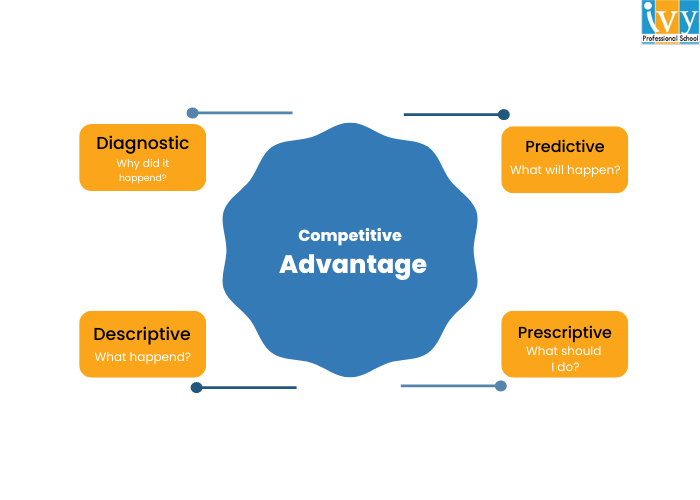
There are four main types of data analytics: descriptive, diagnostic, predictive, and prescriptive analytics. Each of them answers a certain question that helps businesses better understand the past, present, and future and take smart actions to achieve their goals. Let’s understand them in detail:
Descriptive analytics is the most basic type of data analytics currently used. It analyzes historical data to find out what has happened in the past or what is happening in the present.
It uses various techniques such as data aggregation, data mining, and reporting to spot patterns and trends over time. It may use arithmetic means to show an average of the values or frequency distribution to show how often a value occurs in the dataset.
Descriptive analytics uses visualization techniques like creating charts and graphs to visually represent complex data, making it easy to identify trends.
Examples of Descriptive Analytics
Let’s say you run an online store, and you want to know how much you sold in the last six months. So, you will use descriptive analytics to analyze monthly sales data and find peak sales periods and underperforming months. You can also identify top-selling products.
Similarly, businesses can use descriptive analytics to analyze:
Diagnostic analytics helps us go further than descriptive analytics. Now that we already know what has happened, diagnostic analytics helps us answer the valuable question, “Why did it happen?” That means we understand the cause of the trends and patterns we just found in the descriptive analytics.
You may use different methods like drill-down analysis, correlation analysis, Pareto analysis, fishbone diagram, hypothesis testing, etc., to effectively understand the cause of an event. This way, businesses can identify areas of improvement and make better strategies.
Examples of Diagnostic Analytics
Let’s say in the above sales report, you found that a particular month had significantly low sales. So, you use diagnostic analysis and find the cause: you had low product stock and couldn’t meet the customer demand effectively.
Similarly, businesses may use diagnostic analytics to find out:
When you know the problem and why it’s happening, you will be able to find effective solutions to make things better. Now, let’s move to our third type of data analytics:
Related: Data Scientist vs. Data Analyst
Now, we are getting into advanced analysis. Predictive analytics uses historical data, statistical models, and machine learning algorithms to figure out what may happen in the future. It can predict future events, trends, outcomes, and behaviors that may affect the business performance.
Techniques used in this type of data analytics can be time series analysis to identify patterns, regression analysis to identify relationships between variables, or decision trees to represent the decision-making process and predict outcomes. The idea is that once you know what will happen, you can better prepare for the challenges and get ready to take advantage of opportunities.
Examples of Predictive Analytics
Coming back to our online store example, let’s say you found that you had low sales because of an inventory shortage. Now you want to fix this problem. So, you may use predictive analytics to forecast the demand for various products. This way, you can have optimal inventory levels to meet the demand, avoiding inventory shortage as well as overstocking.
Predictive analytics can also be used to:
This is the most advanced type of data analysis that combines descriptive, diagnostic, and predictive analytics. It helps us find out what actions we should take to avoid an undesirable outcome or achieve a desirable outcome.
So, the goal of prescriptive analysis is to provide actionable recommendations. It may use techniques like optimization modeling to find the best solution with given constraints, simulation to evaluate different scenarios, or artificial intelligence techniques to automate decision-making processes.
Examples of Prescriptive Analytics
You used predictive analytics to find the demand forecasts. Now, prescriptive analytics goes further by recommending specific actions to achieve the maximum sales. It suggests how to optimize inventory based on predicted demand, supply chain factors, and business goals. You will also know how much inventory to order and when to order it.
You can also use prescriptive analytics to find actionable insights for these questions:
Now you know the four types of data analytics and how they depend on each other. The goal of data analytics is to help businesses identify areas for improvement, increase efficiency, and enhance processes. That’s why data analysts are in demand in the current industry.
If you want to be a data analyst, you can join Ivy Professional School’s Data Analytics Certification course. This is a live online program taught by industry professionals from IIT, IIM, and US universities. You will learn to use tools like Excel, SQL, Python, R, and Tableau with 50+ assignments, 30+ case studies, & 10+ industry projects. Visit this course page to learn more about it.

Eeshani Agrawal holds an MS in Civil Engineering from Texas A&M University (USA) and has over 16 years of experience in data visualization, storytelling, and analytics. She has consulted for top engineering, manufacturing, and consulting firms worldwide and has coached over 9,000 professionals and students from leading institutions like IITs, IIMs, and ISI.
Anubinda Oct 01, 2021 No Comments
In this blog, we will be covering the conversation of Eeshani Agarwal and Ruchika Saha, who bring us the second episode of the Learn to Visualize series where we are going to learn about Dashboard Actions. Eeshani Agarwal (Data Storyteller and Data Visualization Expert (Tableau, PowerBI, VBA, SQL, Excel). Coached 9,000
UsernamE Aug 15, 2021 No Comments
What is Tableau?
Tableau is a visual analytics platform that helps people and organizations to make the most of their data to solve business problems. Tableau was founded in 2003 which aimed at making machine learning, statistics, natural language, and smart data prep more useful to augment human creativity in analysis.
Anubinda Jul 12, 2021 No Comments I am Komal Wahi, currently pursuing my master’s in economics from St. Xavier’s University, Kolkata. I was very much interested in exploring the world of analytics, and the best decision I made was to join IVY Professional School, Kolkata. I enrolled myself for a
Ivy Apr 03, 2021 No Comments Anubinda Feb 12, 2021 No Comments Anubinda Jan 23, 2021 No Comments Analysis of Data (Data Analytics) is like a kni Anubinda Oct 28, 2020 No Comments Undoubtedly, data science has taken down most industries, making data scientists the most sought job of the 21st ce Anubinda Oct 19, 2020 No Comments Big data is a field that deals with data sets that are too large or too cHow To Crack Data Analytics Competition by Komal Wahi?
Introduction
Data Spotlight: Spotify Wrapped Music Data
All about Big Data Job
Key Business Questions
How to use Data to Answer Key Business QuestionsData Science Success Story of Pranjal Biyani
How to Start a Big Data Career as a Fresher in 2020?