 Ivy Professional School
📅 Apr 17, 2019
Ivy Professional School
📅 Apr 17, 2019
Looking to enhance your BI skills? Some of the most talked about data visualization tools in the market are Tableau, Power BI Qlikview. Some companies even use Spotfire for visualizations as well.
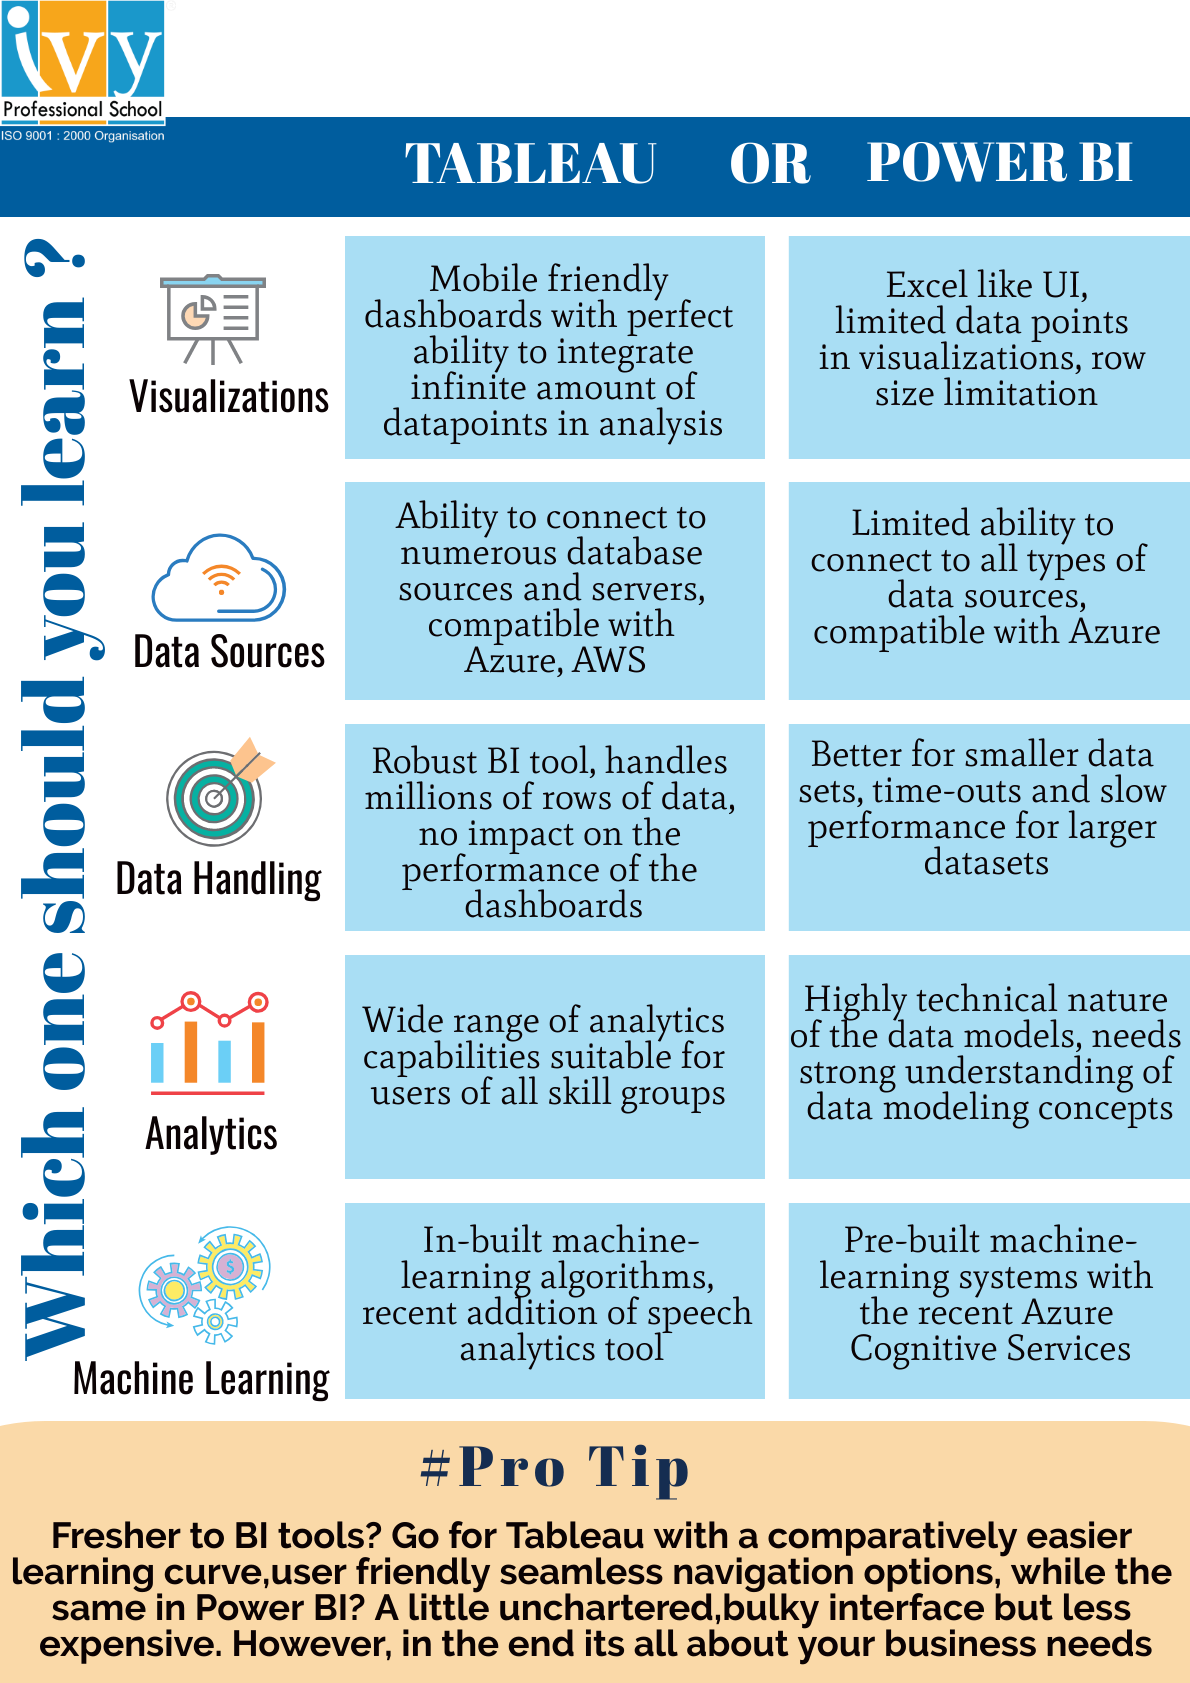
This post is a quick comparison on Tableau or Power BI, which tool should be on your next learning agenda?
While one of them is known for custom visualizations, sometimes a clean curated approach works best. Tableau has also invested in natural language capabilities specifically designed for BI use cases.

Deciding between the two tools should ideally be based on the business needs and the level of drill down analytics required. With an Excel like user interface, Power BI does a good job of providing just basic BI capabilities at a lesser price than the other tool.
But when it comes to a tool that has a more classy and curated approach, Tableau wins hands down. With an easier learning curve, richness of this analytics platform and sleek visualizations and scalability in the longer run lends Tableau a winning edge. Tableau also boasts of a comprehensive support.
Learn more about Data Visualization with Tableau with any of these courses below:
– Shromona Kahali, Content Strategist, Ivy Pro
Leave a Reply