
Team Apr 10, 2026 No Comments
The demand for data engineers in India has exploded, and Data Engineer Salary in India 2026 is now one of the hottest topics among job seekers and professionals looking to switch careers. As companies double down on data-driven decision-making, the role of a data engineer has become critical to business success.
But how much do data engineers actually earn in 2026? And what factors truly influence these salaries?
Let’s break it down in a practical, no-fluff way.
India’s data ecosystem is maturing rapidly. Organizations are no longer just experimenting with data, they are building entire products, platforms, and strategies around it. This shift is directly impacting Data Engineer Salary in India 2026, pushing compensation higher across industries.
Here’s what’s driving this growth:
In simple terms: companies have data, but they desperately need experts who can make it usable.
Let’s get straight to the numbers. The Data Engineer Salary in India 2026 varies significantly based on experience.
| Experience Level | Average Salary (₹ per annum) |
| 0–2 years (Fresher) | ₹5 – ₹10 LPA |
| 2–5 years | ₹10 – ₹20 LPA |
| 5–8 years | ₹20 – ₹35 LPA |
| 8–12 years | ₹35 – ₹60 LPA |
| 12+ years | ₹60 LPA – ₹1 Cr+ |
These figures reflect realistic market trends across startups, mid-sized firms, and large enterprises.
One key insight: the jump from mid-level to senior roles is where salaries accelerate sharply. This is where skills and real-world impact start to matter more than just experience.
Not all companies pay equally, even for similar roles. The variation in Data Engineer Salary in India 2026 is heavily influenced by the type of organization.
If your goal is to maximize your Data Engineer Salary in India 2026, moving toward product-based companies or high-growth startups is often the smartest move.
When analyzing Data Engineer Salary in India 2026, one thing becomes clear: tools alone don’t drive salary—your ability to solve real problems does.
That said, certain skills consistently command higher pay.
Professionals who combine 2–3 of these capabilities often see a significant jump in their Data Engineer Salary in India 2026.
Location still plays a role in determining salaries, although remote work is gradually reducing these differences.
While metro cities dominate high-paying roles, remote opportunities are allowing professionals from smaller cities to access better compensation.
To better understand Data Engineer Salary in India 2026, let’s look at practical scenarios.
A professional transitioning from a non-tech role may start at ₹6–10 LPA. With consistent upskilling, they can reach ₹15–20 LPA within 2–3 years.
With 3–5 years of experience, salaries range from ₹18–30 LPA in product companies. Adding cloud and big data skills can push this beyond ₹25 LPA.
Highly skilled engineers working on large-scale systems earn between ₹40 LPA and ₹1 Cr+. These roles demand strong system design and deep technical expertise.
Many professionals make the mistake of focusing only on tools instead of impact. If you want to grow your Data Engineer Salary in India 2026, you need to think differently.
Here’s what actually works:
The market rewards those who can deliver business outcomes, not just technical knowledge.
The short answer is yes and it’s getting even better.
However, the role is evolving rapidly, which will continue to influence Data Engineer Salary in India 2026 and beyond.
If you stay at a basic skill level, your salary growth will plateau. But if you evolve with AI, cloud, and distributed systems, you will move into the top earning bracket.
Data engineering in India in 2026 is no longer just a “good career option” it’s a strategic, high-income career path.
The gap in Data Engineer Salary in India 2026 between average and top professionals is massive. And that gap is driven by one key factor: the ability to create real business impact through data.
If you are entering this field or looking to grow, focus less on certifications and more on building systems that companies actually need.
Because in today’s market, skills get you hired but impact gets you paid.
Prateek Agrawal is the founder and director of Ivy Professional School. He is ranked among the top 20 analytics and data science academicians in India. With over 16 years of experience in consulting and analytics, Prateek has advised more than 50 leading companies worldwide and taught over 7,000 students from top universities like IIT Kharagpur, IIM Kolkata, IIT Delhi, and others.
This is a

Prateek Agrawal is the founder and director of Ivy Professional School. He is ranked among the top 20 analytics and data science academicians in India. With over 16 years of experience in consulting and analytics, Prateek has advised more than 50 leading companies worldwide and taught over 7,000 students from top universities like IIT Kharagpur, IIM Kolkata, IIT Delhi, and others.
Team Jan 05, 2023 No Comments
It is difficult to monitor and analyze data from various sources. Best dashboard software concentrates data into a single place and you can evaluate KPIs) key performance indicators) via several filters. The display appears via charts, graphs, and tables. In this article, we will have a look at the top dashboard software comparison where we will compare the top three dashboard software and how it can help you build your data career. But before we get into the top dashboard software, let us have a look at its definition.
Dashboard software is an information management tool that tracks, collects, and presents company data in interactive visualizations that are fully customizable and allow users to monitor an organization’s health, examine operations, and gain useful insights.
When you are searching for a dashboard tool for visualizing data for your company, time-saving characteristics such as embeddability might be mentioned in your list. What about mobile BI and geospatial analytics?
Comparing contemporary BI tools may resemble navigating a maze; the more you learn about their characteristics, the more perplexing it becomes. This article will do a top dashboard software comparison. Also if you are looking for the best dashboard software for small businesses, then this is the ideal article for you. So without any further delay, let us begin.
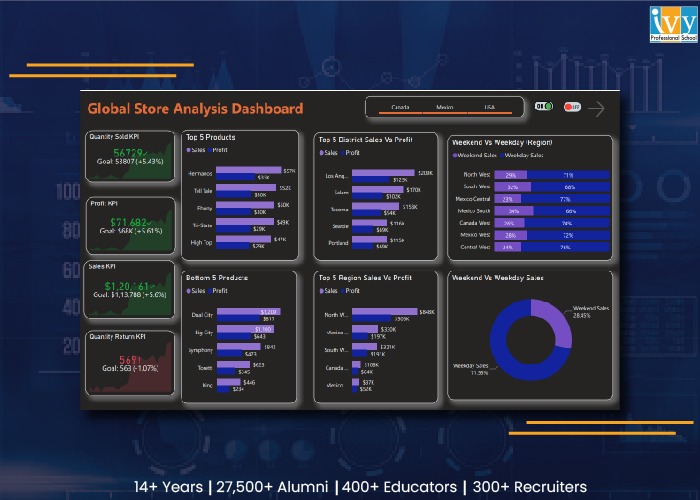
Microsoft first published Power BI as an Excel add-on before releasing it as a SaaS service. It is now a stand-alone reporting and analytics solution for businesses of all sizes. It smoothly connects with other products from the vendor, including Office 365, because it is a member of the Microsoft family.
You may assess your company’s assets seamlessly from within business apps because it embeds readily. Effective querying, modeling, and visualization are made possible by its Power Query, Power Pivot, and Power View modules.
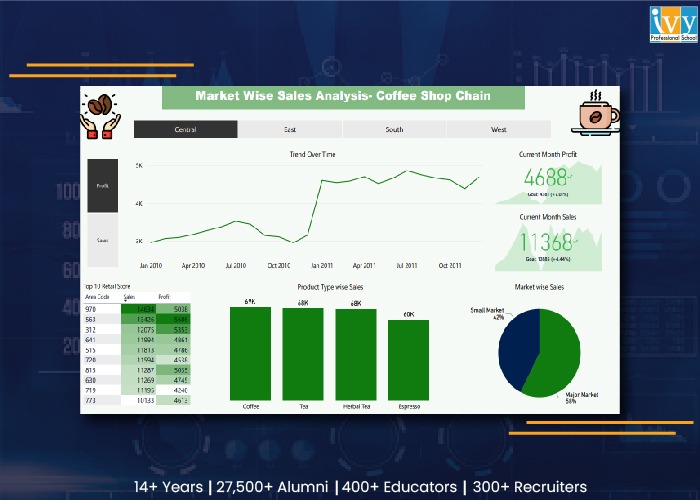
The free visuals that you may view online and download are what make Tableau so popular. With a high level of customization and programmable security features, it allows you total control over your data.
The drag-and-drop functionality and user-friendly UI make adoption simple. Although Tableau Desktop is the vendor’s main product, a license for Tableau Server or Tableau Online is included.
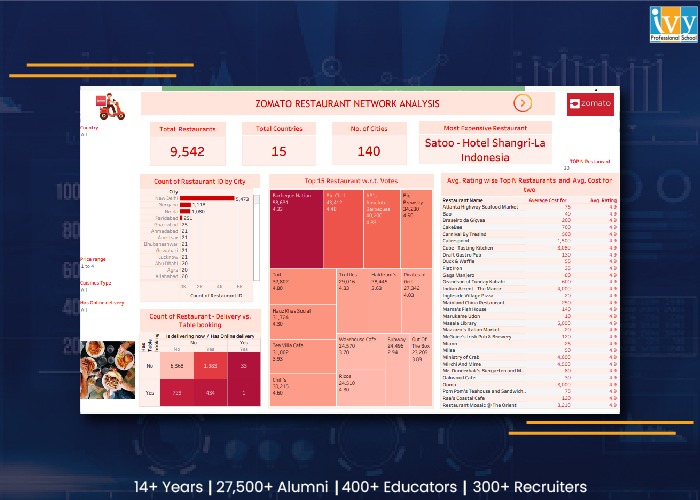
The traditional BI offering from Qlik, QlikView, assisted clients in making the transition from complex, IT-driven, SQL-centric technology to agile insight discovery. However, it can no longer be purchased. Since then, Qlik has unveiled Qlik Sense, a cutting-edge platform for self-service analysis. It supports a wide range of analytical requirements. They include:
Its Associative Engine examines each potential connection between datasets to unearth buried knowledge. The program can be installed locally as well as in private and public clouds. The seller offers Business and Enterprise, two subscription-based variants.
Now that you have got an idea about the top dashboard software, let us finally begin with the comparison based on individual features.
PowerBI:
It integrates with current on-premises and cloud analytics investments, particularly Microsoft ones. It integrates with current on-premises and cloud analytics investments, particularly Microsoft ones. It also supports a number of other systems, including Google BigQuery, Pivotal HAWQ, Hortonworks, Apache Hive, and Databricks Cloud. Information from Google Analytics, MySQL, Oracle, Salesforce, MailChimp, Facebook, Zendesk, and other sources can be combined.
Tableau:
It comes with built-in connections for Microsoft Excel, Amazon Redshift, Cloudera, Google Analytics, MySQL, and more, or you may make your own. Tableau falls short of Power BI in the area of third-party integrations. It only connects to platforms for project management, payment processing, business messaging, and online shopping through partner integrations.
Qlik Sense:
When comparing Qlik and Tableau, Qlik Sense has native connectors as well. Any that aren’t natively offered can be downloaded from the Qlik website. The latest sources that the vendor has added support for are the Databricks ODBC and the Azure Synapse connector.
However, it doesn’t support platforms for accounting, online commerce, or payment processing.
Verdict:
Power BI comes out on top. Although it lacks SAS connectivity, it makes up for it with additional sources and third-party connectors.
In this top dashboard software comparison, all tools offer end-to-end data management.
Power BI:
Its Query Editor allows the user to blend data with effective profiling. You can illustrate custom metrics via reusable data structures. The SSAS module of Microsoft for OLAP connects to sources in real-time.
Tableau Prep:
It is the exclusive offering of the vendor for data management. You can construct data workflows such as renaming and duplicating fields, filtering, editing values, and altering data types with its Prep Builder module. Prep Conductor helps in scheduling and monitoring this roadmap.
The top dashboard software comparison witnesses both coming through for OLAP. Tableau links seamlessly to Oracle Essbase, Microsoft Analysis Services, Teradata OLAP, Microsoft PowerPivot, and SAP NetWeaver Business Warehouse.
Qlik Sense
In terms of comparing Tableau with Qlik Sense, Qlik Sense mixes, transforms and loads data from several sources. AI recommendations, concatenation, and link tables can be used to find correlations.
By combining various data kinds, intelligent profiling produces descriptive statistics. The cognitive engine of Qlik automates process creation and data preparation. It offers suggestions for visualizations and connections.
Verdict
In the top dashboard software comparison, all three tools are tied for first place in data management.
Through interactive visualizations, Power BI, Tableau, and Qlik Sense offer visual data snapshots. For in-depth knowledge, you can filter and edit datasets. The most recent measurements are provided by periodic data refreshes.
Power BI:
You can have a preview of the underlying reports and datasets through its displayed metrics. Any report’s tile can be pinned to your dashboard, and the toolbar can be used to change the dashboard’s appearance. You can designate a dashboard as a favorite and set up alerts to track important indicators.
Although they are not included, dashboard templates are available through template apps. Animations are supported by Power BI, but only with end-user modification.
Tableau:
Tableau’s Dashboard Starters, which create dashboards after connecting to well-known sources, are more convenient when compared to Power BI. Create your own visualizations, or download and reproduce those created by the user base. By illustrating alterations over time, out-of-the-box animations improve visual presentations.
Qlik Sense:
View the performance of your company on important indicators with charts and graphs. Utilize the video player visualization in Qlik Sense apps to embed YouTube videos. There are animations available.
Verdict
When comparing Microsoft Power BI, Tableau, and QlikView for visualization, Qlik Sense and Tableau come out on top.
All three tools support planned and ad hoc reporting. You may easily create master item lists within bespoke apps using Qlik Sense to create reports. You must publish test workbooks on Tableau’s server before you can create reports in the program.
Power BI
Even inside a firewall, its Report Server’s strong governance mechanisms allow for the distribution of reports. Although the program doesn’t enable versioning, it does support permission management and role-based access. You can sign up for automatic report delivery that is configured to occur following the most recent refresh.
By merging with Narrative Science Quill, a third-party solution, it supports intelligent storytelling.
Tableau:
You may analyze data more quickly by using its Ask Data module to ask questions in natural language. Versioning is possible, allowing you to view what has changed since the previous version. Register to receive reports in PDF or image format via email.
Qlik Sense
Natural language searches are supported by its Insight Advisor module. There is no built-in mechanism for automatic report transmission; Qlik NPrinting is required. The Qlik Sense Hub also offers instant access to reports.
Versioning is supported by the tool, but with third-party integrations.
Verdict
Tableau wins the reporting comparison in the top dashboard software comparison, thanks to its built-in versioning and subscription-based report delivery.
When comparing Power BI, Tableau, and Qlik Sense, all of the tools provide in-memory analysis for high-speed queries.
Power BI
Live connections allow you to form reports from shared models and datasets and save them to your workspaces. The Query Editor allows over 350 transforms that include the remaining columns and tables, removing rows, setting the first rows as headers, and many more.
Batches update functionality is not built-in, but you can also do it via bulk operations.
Tableau
Through its visual query language, VizQL, you can easily query corporate assets. You can also append, mix, and aggregate particular datasets if you are familiar with SQL. Create unique live connections and make them available to others on the Tableau server.
Qlik Sense
When contrasting Qlik with Power BI, Qlik includes a Direct Discovery module for creating connections to live sources. Batch updates can be built-in. The Qlik Data Integration Platform updates data from live sources incrementally.
Verdict
As a result of its batch updates and effective visual querying, Tableau takes first place in this category.
Power BI
To keep track of users, it features an activity log. Additionally, the supplier bundles Office 365 with an audit log that records events from services like Sharepoint Online, Exchange Online, Dynamics 365, and others. The platform offers row, column, and object-level security, and it encrypts data both when it is in transit and when it is being processed.
Tableau
The manufacturer offers LogShark and TabMon as two open-source tools to evaluate the performance and usage of Tableau Server. By placing published dashboards behind logins, you can safeguard your live data.
Qlik Sense
Through Telemetry Logging, Qlik enables you to record CPU and RAM utilization along with activity measurements. The Content Security Policy (CSP) Level 2 stops injection attacks and Cross-Site Scripting (XSS). An additional layer of protection is provided via MFA (Multi-Factor Authentication) and API-based key configuration.
The tool allows row and column-level security via a section access login and encryption only at rest.
Verdict
When comparing Microsoft BI, Tableau, and Qlik Sense for information security, Power BI comes out on top.
Power BI
It offers vizualization based on the location that can be pinned to dashboards by incorporating ArcGIS Maps, Bing Maps, and Google Maps. Or visuals can be created based on TopoJSON maps. Geospatial operations and calculations are accessible via Power Query or Data Analysis Expressions.
Tableau
One can do advanced spatial analysis in Tableau by mixing geodata files along with spreadsheets and text files. It provides revInstead, it leverages Qlik’s GeoAnalytics connector, the GeoAnalytics Server and other extensions. erse and forward geocoding natively. Reverse geocoding offers valuable location insight for delivery and fleet tracking. IoT (Internet of Things), data and photo enrichment, and payment processing.
Qlik Sense
It doesn’t offer to geocode, geospatial functions, WMS integration, and spatial file support. Instead, it makes use of the GeoAnalytics Server, Qlik’s GeoAnalytics connection, and other add-ons. Another add-on that enhances the tool’s geolocation capabilities is Qlik Geocoding.
Verdict
Tableau leads the pack with its robust map search feature, interactive visualizations, and geospatial interfaces in a range of formats.
Power BI
Regardless of whether your data is on-premises or in the cloud, get safe access to live reports and dashboards when you’re not at the office. You can form reports on your mobile, set up alerts, and ask queries. Share the report and the dashboard and collaborate with others via comments. Annotations, and also @mentions.
Tableau
Its mobile application allows the user to search, browse, and scroll through dashboards on their mobiles. The user can also preview their visualizations and also their workbooks and interact with them when they are offline.
Qlik Sense
The user can access the Qlik Sense application and mashups on mobile along with all other characteristics such as creation, visualization, analysis, administration, and collaboration. Add context to analytics along with a convincing narrative and form active discussions that revolve around business assets through collaboration.
Verdict
Due to its powerful mobile intelligence features, Power BI takes first place in this category.
In conclusion, Power BI wins in maximum parameters making Qlik Sense grab the second position. When all is said and done, the winning option might not be the best one for you. Nevertheless, this feature-to-feature comparison should help you determine the qualities to seek in a BI application. Software pricing varies depending on the feature set, add-ons, and deployment style, even if cost is a major consideration.
But just having gotten these top dashboard software will not solve your issue. You need to know how to use this software. This software is specifically used in the data industry and if you wish to enter this industry, you need to know these tools. The best institute that offers courses on data analytics and data science is Ivy Professional School. It offers great courses in data science and data engineering that you can enroll in. They offer expert-led courses along with complete placement assistance. Join Ivy and get to work on real-life insurance data science projects to make your resume more reachable to recruiters. For more details visit their website.
The three top dashboard software are Power BI, Tableau, and Qlik Sense.
Top dashboard software includes Power BI, Tableau, and Qlik Sense.
Domo is not your typical dashboard application. Because Domo’s dashboards are built on its platform, your data is always current.