
Team Dec 29, 2022 No Comments
It is not surprising that Data Science is growing rapidly and is expected to reach a market worth USD 350 billion by the end of 2022. The hierarchy has been divided into many categories, such as Data Scientists, Data Analysts, Data engineers, etc., and they are monopolizing the IT sector as a result of the increasing demand and speed. This article will act as a roadmap for Data Analysts.
As per the recent survey, it was found that the market was unsuccessful in fulfilling the demand for Data Analysts for the past couple of years and is the reason people are shifting their careers into the Data Science niche because of the major attraction that this niche offers which is growth and salary opportunities.
These easy steps will help you in building your career in Data Science. Data Science is no rocket, you just need to follow a few steps and be dedicated to achieving what you wish. Then becoming a Data Analyst is just a matter of a few months. So without any further delay let us begin with the roadmap for Data Analyst.
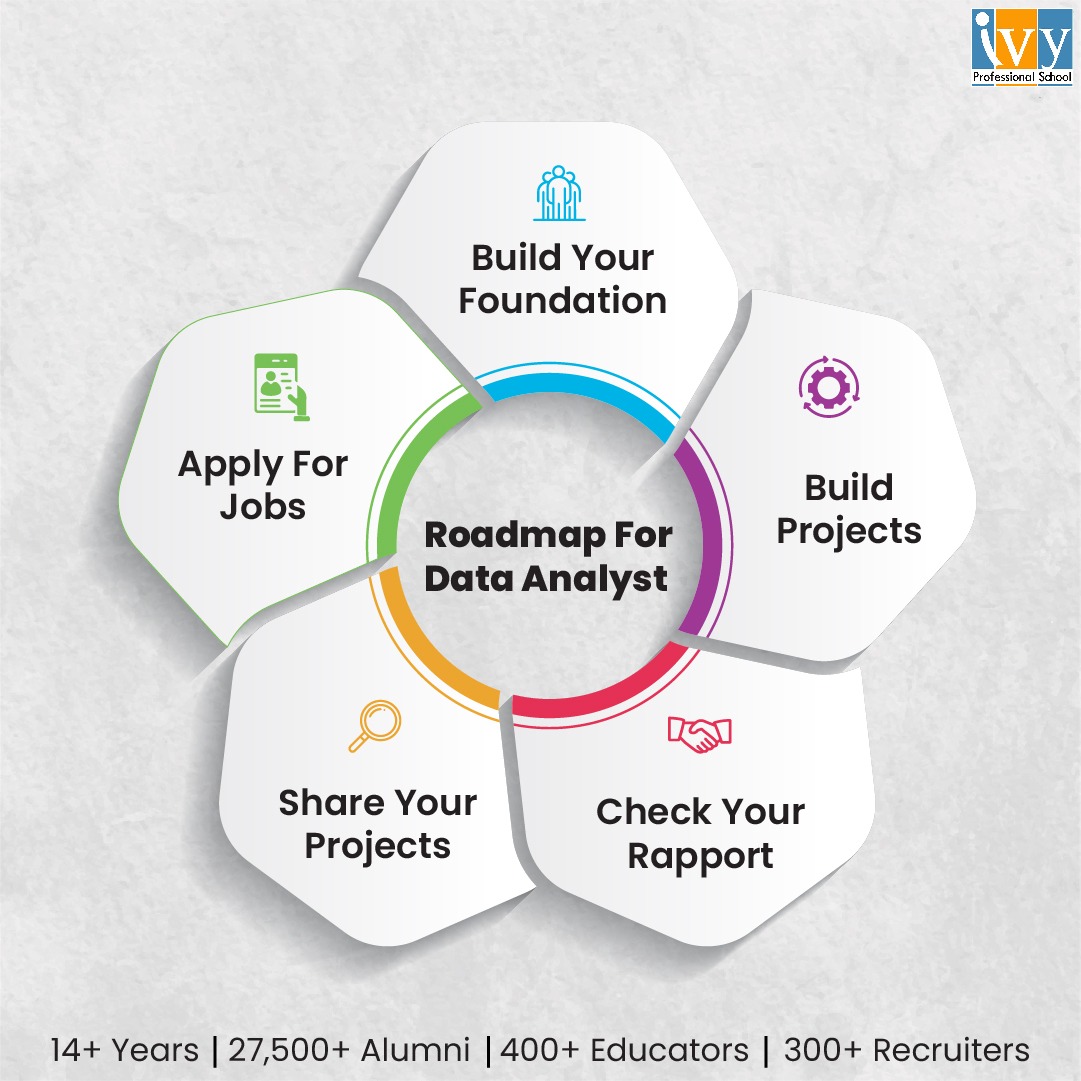
It is very crucial to have your basics ready. The Data Science industry is all about understanding and if you have that, you are almost there. To create a solid foundation, the first step you will have to take is to enroll in a good data analytics course. Learning the basics will help you a lot in your career. Along with this if you get the chance to practice on some real-life industry-level projects then that will help you more. In this respect, we would take some time to tell you about Ivy Professional School. This is a data analytics institute that offers industry-relevant courses along with real-life projects and placement assistance. Ivy understands the importance and scope of Data Science in the present market scenario and creates its courses accordingly. Their courses are led by industry experts and help a lot in enriching your resume with real-life projects.
This is one of the most crucial steps in this roadmap for Data Analyst. As stated above, working on real-life projects will increase the weightage of your resume and will also help you in building confidence. There are a few ways to work on real-life projects:
Here are some of the examples that you can consider in creating your project.
Connect and network with like-minded people on Twitter, LinkedIn, or any other social media site you want. For instance, building relationships in this way should be your strategy if you want to improve as an analyst.
Let the Data Science industry know you. Showcase your projects on various social media handles. There are a few points to keep in mind while you share your projects.
When you have the above-mentioned steps, you can start to apply for jobs. The best thing about the Data Science field is that you can apply for jobs based on specific tools. So suppose you opt for Data Science With Vizualization certification course at Ivy, you can apply for the tools like Excel, or Power BI once they are completed individually. So this is the benefit that this industry offers.
There are various portals from where you can apply such as LinkedIn, Naukri, Indeed, and many more. But the best among them is LinkedIn. It offers wide exposure to all the spheres of recruitment. Here are some ways by which you can look for jobs in the Data Science domain:
With this, your roadmap for Data Analyst ends. Follow these steps with determination and smart work to achieve optimum results.
Today, billions of businesses produce data every day and use it to inform important business choices. It aids in determining their long-term objectives and establishing new benchmarks. In today’s world, data is the new fuel, and every industry needs Data Analysts to make it useful. The market share of Data Analysts is expected to increase by USD 650+ billion at a CAGR of around 13%, making it one of the most sought-after professions in the world. The more data, the greater the need. So if you are planning to make your career in data analytics then it is indeed the best choice. Hope this roadmap for Data Analyst helped you. You can also get free 1:1 career counseling to clear all your doubts regarding this industry. For.. more details visit Ivy’s official website.
Team Jul 20, 2022 No Comments

Data analytics is all about collecting and analyzing raw data to find valuable patterns and insights that answer questions or solve problems. This helps businesses make smart decisions, improve efficiency, increase customer satisfaction, and drive more revenue.
If you want to master data analytics, you must know the different types of data analytics employed in industries. So, in this post, we will discuss the four main data analytics types in detail with examples. You will understand what they are, how they differ from each other, and why they are important.
There are four main types of data analytics: descriptive, diagnostic, predictive, and prescriptive analytics. Each of them answers a certain question that helps businesses better understand the past, present, and future and take smart actions to achieve their goals. Let’s understand them in detail:
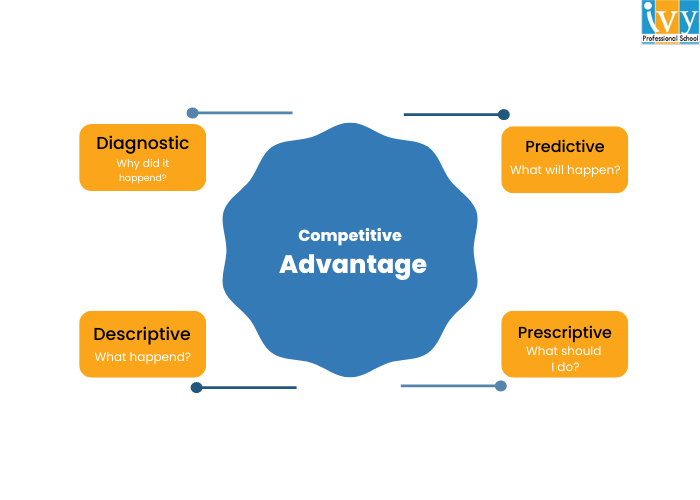
Descriptive analytics is the most basic type of data analytics currently used. It analyzes historical data to find out what has happened in the past or what is happening in the present.
It uses various techniques such as data aggregation, data mining, and reporting to spot patterns and trends over time. It may use arithmetic means to show an average of the values or frequency distribution to show how often a value occurs in the dataset.
Descriptive analytics uses visualization techniques like creating charts and graphs to visually represent complex data, making it easy to identify trends.
Examples of Descriptive Analytics
Let’s say you run an online store, and you want to know how much you sold in the last six months. So, you will use descriptive analytics to analyze monthly sales data and find peak sales periods and underperforming months. You can also identify top-selling products.
Similarly, businesses can use descriptive analytics to analyze:
Diagnostic analytics helps us go further than descriptive analytics. Now that we already know what has happened, diagnostic analytics helps us answer the valuable question, “Why did it happen?” That means we understand the cause of the trends and patterns we just found in the descriptive analytics.
You may use different methods like drill-down analysis, correlation analysis, Pareto analysis, fishbone diagram, hypothesis testing, etc., to effectively understand the cause of an event. This way, businesses can identify areas of improvement and make better strategies.
Examples of Diagnostic Analytics
Let’s say in the above sales report, you found that a particular month had significantly low sales. So, you use diagnostic analysis and find the cause: you had low product stock and couldn’t meet the customer demand effectively.
Similarly, businesses may use diagnostic analytics to find out:
When you know the problem and why it’s happening, you will be able to find effective solutions to make things better. Now, let’s move to our third type of data analytics:
Related: Data Scientist vs. Data Analyst
Now, we are getting into advanced analysis. Predictive analytics uses historical data, statistical models, and machine learning algorithms to figure out what may happen in the future. It can predict future events, trends, outcomes, and behaviors that may affect the business performance.
Techniques used in this type of data analytics can be time series analysis to identify patterns, regression analysis to identify relationships between variables, or decision trees to represent the decision-making process and predict outcomes. The idea is that once you know what will happen, you can better prepare for the challenges and get ready to take advantage of opportunities.
Examples of Predictive Analytics
Coming back to our online store example, let’s say you found that you had low sales because of an inventory shortage. Now you want to fix this problem. So, you may use predictive analytics to forecast the demand for various products. This way, you can have optimal inventory levels to meet the demand, avoiding inventory shortage as well as overstocking.
Predictive analytics can also be used to:
This is the most advanced type of data analysis that combines descriptive, diagnostic, and predictive analytics. It helps us find out what actions we should take to avoid an undesirable outcome or achieve a desirable outcome.
So, the goal of prescriptive analysis is to provide actionable recommendations. It may use techniques like optimization modeling to find the best solution with given constraints, simulation to evaluate different scenarios, or artificial intelligence techniques to automate decision-making processes.
Examples of Prescriptive Analytics
You used predictive analytics to find the demand forecasts. Now, prescriptive analytics goes further by recommending specific actions to achieve the maximum sales. It suggests how to optimize inventory based on predicted demand, supply chain factors, and business goals. You will also know how much inventory to order and when to order it.
You can also use prescriptive analytics to find actionable insights for these questions:
Now you know the four types of data analytics and how they depend on each other. The goal of data analytics is to help businesses identify areas for improvement, increase efficiency, and enhance processes. That’s why data analysts are in demand in the current industry.
If you want to be a data analyst, you can join Ivy Professional School’s Data Analytics Certification course. This is a live online program taught by industry professionals from IIT, IIM, and US universities. You will learn to use tools like Excel, SQL, Python, R, and Tableau with 50+ assignments, 30+ case studies, & 10+ industry projects. Visit this course page to learn more about it.

Eeshani Agrawal holds an MS in Civil Engineering from Texas A&M University (USA) and has over 16 years of experience in data visualization, storytelling, and analytics. She has consulted for top engineering, manufacturing, and consulting firms worldwide and has coached over 9,000 professionals and students from leading institutions like IITs, IIMs, and ISI.
Ivy Nov 24, 2014 1 Comment
Whether you are an analytics pundit or a newbie wanting to work with data, you simply cannot ignore the ubiquitous Microsoft Excel.
From being a simple spreadsheet programme containing loads of data, MS Excel has emerged as a BI tool, indispensable for data professionals. Its unlimited potential to work with data and statistical analyses makes it a robust, feature-filled tool that can be levera
Ivy May 15, 2014 No Comments
Data is everywhere whether in unstructured or structured form. Yet stand alone data makes no sense unless measured, managed or optimised. To gain valuable insights into a given set of data, the data has to lend itself to analysis using a clearly defined methodology, strategy and business goals.
What this means.
Data is to be questioned, transformed into information and shaped to des